Effects of Hurricane Sandy visualized across the USArray
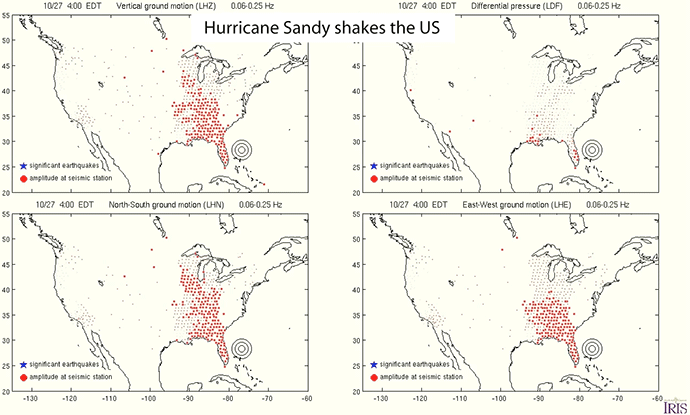
The Earthscope USArray, a network of approximately 400 uniformly distributed stations rolling across North America, remarkably captures the seismic wavefield propagating across the North America as shown by the IRIS USarray Ground Motion Visualizations. In 2011 infrasound sensors measuring atmospheric pressure were added to all USArray stations sites allowing the continental scale array to illuminate the wavefield of various atmospheric acoustic sources as well. An example is Hurricane Sandy and the cold front that came from the west, which merged and formed the so called Frankenstorm of 2012. A one minute animation spanning three weeks around Sandy shows the storm’s effects on seismic background noise and atmospheric pressure across USArray.

The three seismic channels shown plot hour long median levels of background noise in a narrow frequency range called the microseism. This noise is primary background seismic hum of the Earth and is caused by wind generated standing waves in the ocean beating on the seafloor like a drum. The microseism is composed mostly of Rayleigh waves, a type of surface wave that is polarized in the direction of propagation. The animation highlights the microseism getting louder and quieter as Sandy’s intensity and proximity to the land changes. The upper right panel in the animation plots median differential atmospheric pressure and clearly shows the leading edge of the cold front coming in on October 17 from the northwest.
Infrasound research in the literature is becoming more prolific as data availability grows. In step with the community, IRIS is taking an active role not only by archiving and distributing infrasound data, but also in data products utilizing these data such as the IRIS DMC TA Infrasound Data Products. We are continuously expanding our data product offerings: see the related article in this issue of the newsletter.
More information
by Alex Hutko (IRIS Data Management Center)


