OBSIP: Supporting Cascadia Initiative and Improving Ocean Bottom Seismograph Data Quality
About OBSIP
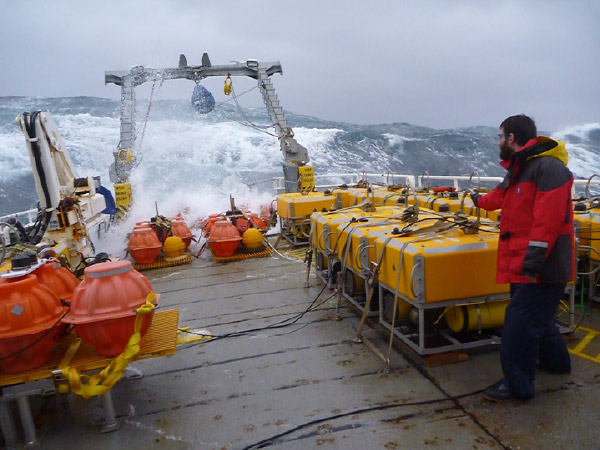
The Ocean Bottom Seismograph Instrument Pool (OBSIP) provides ocean bottom seismometers (OBSs) to support research in marine geology, seismology and geodynamics. OBSIP manages three Institutional Instrument Contributors (IICs): Lamont Doherty Earth Observatory (LDEO), Scripps Institution of Oceanography (SIO), and Woods Hole Oceanographic Institute (WHOI). Each IIC provides instruments for experiments and provides technical support for the instruments. One of the goals of OBSIP is to improve data quality for the OBS instruments. OBSIP works closely with the IRIS DMC to make sure that all data users receive correct and complete data.

About Cascadia Initiative
Currently, OBSIP is in the midst of a large community-designed project called the Cascadia Initiative. Cascadia is an onshore/offshore seismic and geodetic experiment that was deployed in the Pacific Northwest of the United States. Cascadia will address a wide-range of topics about the Juan de Fuca and Gorda plates including megathrust earthquakes, volcanic arc structure, and the formation, deformation, and hydration of the subduction system.
Cascadia utilizes both onshore and offshore data. The OBSs will be used to extend the EarthScope Transportable Array into the offshore environment (spacing ~70 km, equivalent to the onland stations) and to build three denser sub-arrays. Sixty new OBS instruments were built for the Cascadia project. LDEO has developed and built twenty instruments to deploy in shallow water that are mounted in trawl-resistant frames. The OBSs will be deployed in four one-year segments.
How the DMC and OBSIP are working to improve Cascadia data
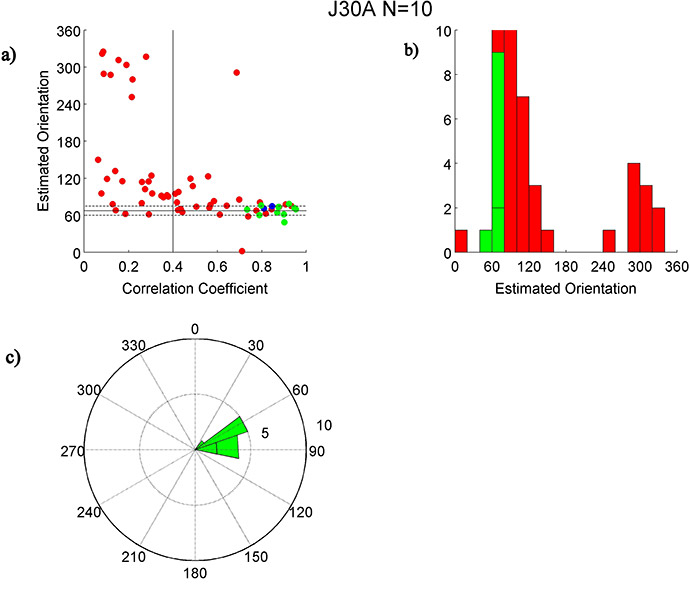
The first year of Cascadia data was recovered in summer of 2012 and subsequently uploaded to the DMC. A major difference between offshore and onshore seismometers is that OBS are deployed remotely so their orientation on the seafloor is unknown. In order to make the first year of the Cascadia data set most useful to a wide array of investigators (including those who have traditionally worked with land stations), OBSIP calculated the horizontal orientations of the Cascadia seismometers. Focusing on the surface wave arrivals from teleseismic events, the horizontal components are rotated by 1-degree increments and compared to the vertical component. The correlation coefficient between the phase shifted vertical component and predicted radial component should be highest at the ideal estimated orientation. By determining this orientation for many events, we can calculate the approximate horizontal orientation for the station (Figure 2).
Full details on determining the horizontal orientation can be found in the published report

An important aspect of determining accurate horizontal orientations is to understand the background seismic noise at each station. The PQLX software distributed by the DMS was used to generate power spectral density estimates that allowed the scientists at OBSIP to characterize the typical ambient noise at the Cascadia stations. By comparing the power spectral density estimates of each instrument, OBSIP is gathering data about how instruments perform under variable conditions. Shallow water OBS deployments demonstrate higher noise than deep-water deployments. The trawl resistant frame OBSs developed by LDEO appear to have less long period noise. As the Cascadia project continues, OBSIP will continue to assess the performance of each instrument and look for ways to work with IICs to improve OBSIP Instrumentation.

Both IRIS and the IICs are committed to providing reliable, timely, and good quality data for the community. For example in the data analysis for the Cascadia project, timing issues were identified with the LDEO Absolute Pressure Gauge data. The DMS restricted access to the channels with timing issues, preventing the further release of known data issues to the public. The DMS, IICs, and OBSIP will continue to work together to help resolve future data-related issues.
OBSIP is currently recovering instruments deployed during the second year of the experiment and expects to make year 2 data available in the early fall of 2013. Following recovery, the Cascadia instruments will be refurbished and deployed for the third year of the experiment.
by Jessica Lodewyk and Brent Evers (IRIS)


