Very old Mount St. Helens data arrives at the DMC

In the early days of digital seismic data, before IRIS existed, a seminal geophysical event took place in the US Pacific Northwest in May of 1980: the cataclysmic eruption of Mount St. Helens. In the two months preceeding the main eruption, an intense earthquake swarm was recorded by instruments installed by the University of Washington (UW) and United States Geological Survey (USGS). A brand new digital seismic acquisition system had just been installed at the UW. This event-triggered system recorded many earthquakes in the sequence but because it couldn’t keep up with the intensity of the swarm many events were missed. Only about 800 of the many thousands of events occurring during this period were recorded digitally. The digital waveforms from these events were eventually archived at the IRIS Data Management Center (DMC) in 1995 and since then millions of waveforms have been requested for study by hundreds of researchers. While this is a valuable data set, it is nowhere near complete enough to really characterize the precursors to that historic eruption.

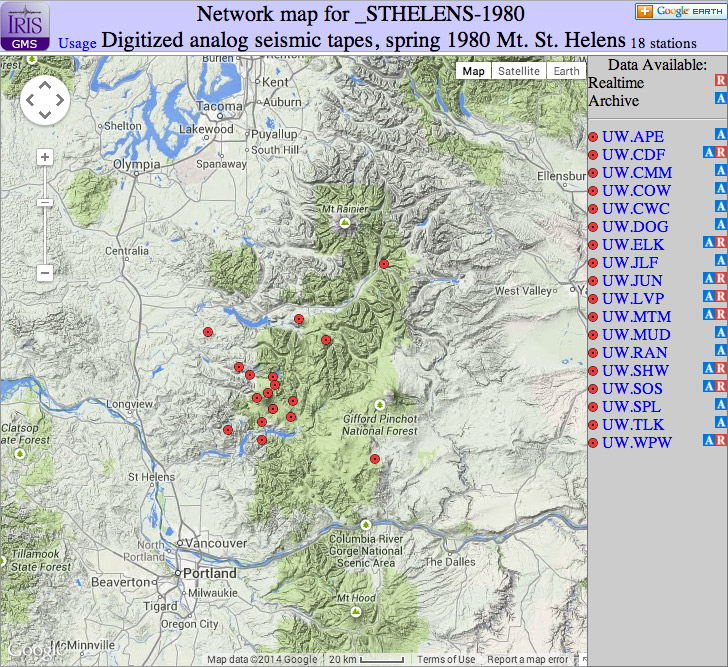
Fast forward to 2005; when old, continuous, analog tapes of some of the stations were “rediscovered” from storage and tests indicated they could be digitized to make semi- continuous digital waveform records. With help from USGS staff and a grant from the USGS data rescue fund selections of waveforms from 17 different stations near Mount St. Helens were digitized. Because of the age of the tapes great care and special processing, including baking them in an oven was needed. While many were done by hand in an amateur way a set of 1 inch tapes were sent to a professional specializing in data recovery from old analog tapes. Off and on over the following 8 years the very laborious process of setting station/channel names, equivalent digitizing rate and date-time stamps were done.
There were two classes of analog tapes. One set included up to 14 channels of seismic and timing information from telemetered analog stations (some of the same stations that were recorded by the event triggered computer in real time). The others were from autonomous field stations recording on 1/2 inch tape at slow speed that lasted five days per tape. The digitizing and processing of these different types were done in very different ways but the final result of data at the DMC is similar. Figure 1 illustrates the several steps these data have gone through. The two different types of data tapes were handled quite differently though there were some parts of the processing that share common software.
Digitized analog waveform data have many data quality problems. The primary one is timing. Because of tape speed variations both during recording and playback and tape stretch even a highly precise digitizer will produce equivalent digitizing rate variations in the final products. In most cases a time code is digitized at the same time as the waveform data. However, this can be in error due to clock drift or WWVB radio fade-out so providing accurate time stamps for resulting digital waveforms is next to impossible. Those wishing to use these data for accurate timing (phase picking) will need to use a time-code channel that accompanies the waveform channels for each station. Be advised that even that is sometimes not of much use.
Because of tape deterioration the signal to noise recordings on these waveforms (and time-code signals) can decrease to almost nothing at times. On top of these issues there is the problem of effectively calculating accurate instrument responses. Old passive seismometers producing signals going through a variety of electronic steps before being recorded and then the subsequent steps of playing back the data, takes a complicated and variable path. Many of the characteristics of these old systems have been lost during the past 30+ years and thus the required meta-data (dataless SEED) associated with the archived waveforms is is subject to great error. By comparing waveforms from the original digital records for selected events with those of the re-digitized analog records approximate response information has been determined for some of the stations. Others are just semi-educated guesses.

In any case the value of these data is not their high quality (which they aren’t) nor their timing (which is poor) but rather it is in the semi-continuous record they provide for a semi-quantitative view of the pre-eruption seismic sequence. No one station has continuous data for the whole period; however, by using overlapping sequences of different stations a pretty complete record should be able to be produced of approximately when, how big and what types of events took place. Such efforts are underway but any and all students of volcano seismology are welcome to glean what ever new insights might be forthcoming from analyzing this problematic but very interesting data set.
by Steve Malone (University of Washington) and Rick Benson (IRIS Data Management Center)


