


IRIS Ground Motion Visualization (GMV) data product expands as USArray moves to Alaska

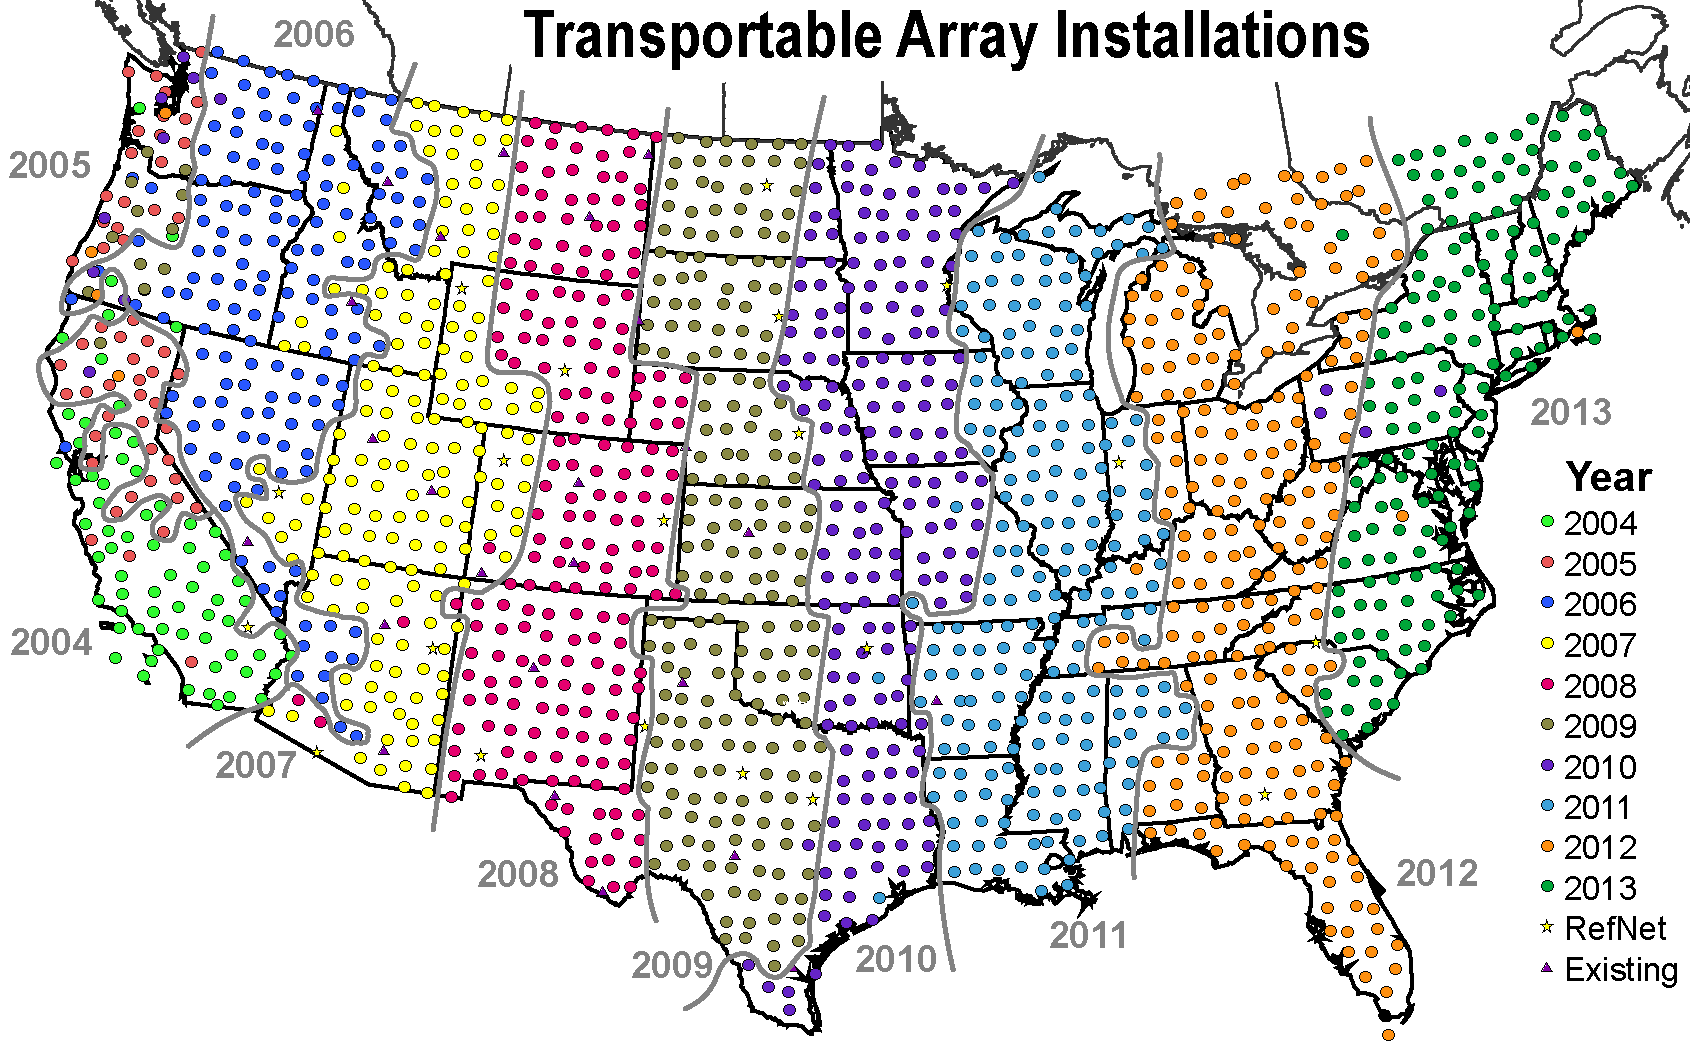
In February 2010, IRIS DMC started automated production of its video-based Ground Motion Visualization (GMV) data product. GMV illustrates how seismic waves travel away from an earthquake location by depicting the normalized recorded wave amplitudes at each seismometer location using colored station symbols to represent seismic wave amplitudes. This data product relies mainly on the waveform data from the Transportable Array (TA) stations of the USArray/EarthScope project, which is a rolling array of 400 broadband stations deployed on a uniform 70-km grid (see the TA deployment map).
By focusing mainly on TA stations, GMV has processed over 2100 events that have occurred between start of the TA deployment in 2004 and present (2015). These GMVs use a fixed viewport that covers the contiguous United States (Figure 1). However, in 2014 USArray completed its coverage of the contiguous United States and started moving its stations to Alaska.
To follow the TA stations to Alaska, we have expanded the GMV viewport to include the Alaska stations. Starting with the September 24, 2015 events, GMV provides 3 viewports via a tabbed menu (Figure 2, left):
- left tab — displays the classic GMV with the viewport limited to the contiguous United States (similar to Figure 1)
- center tab — displays the expanded GMV covering both the contiguous United States and Alaska (Figure 2, left)
- right tab — the Alaska only view (Figure 2, right)
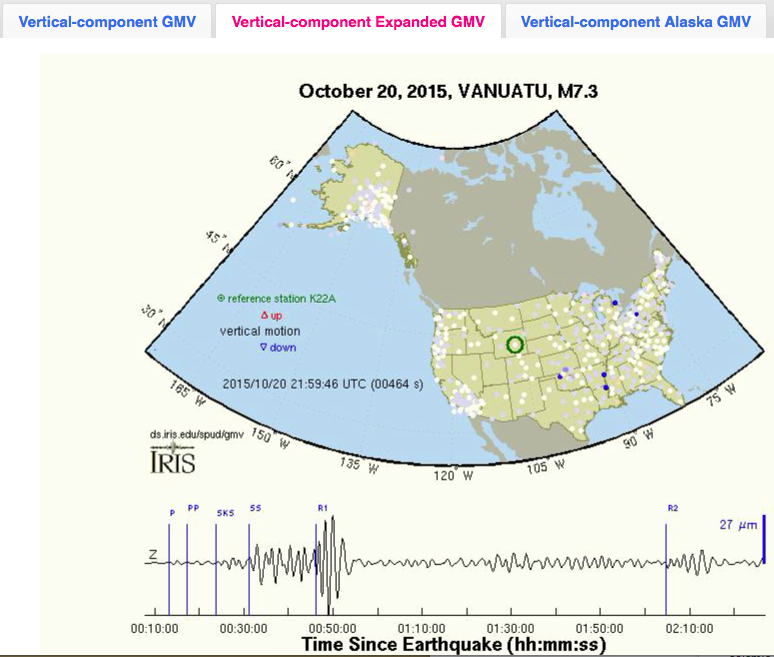
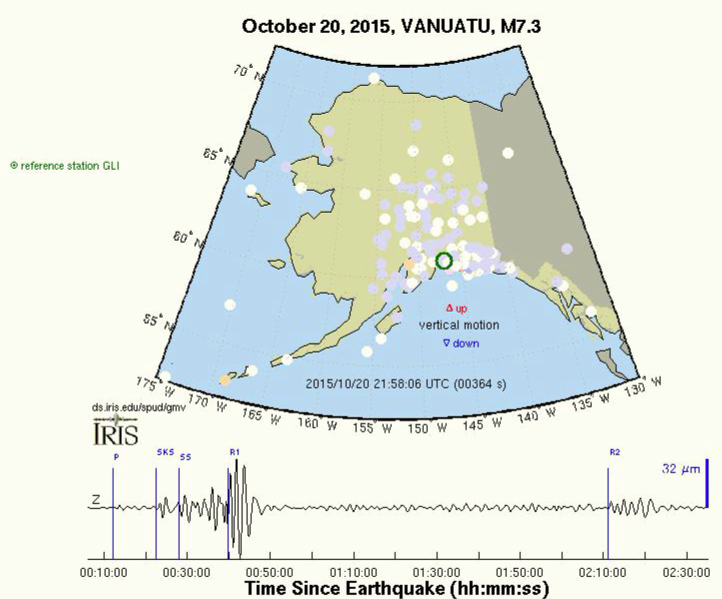
Figure 2. GMV now support 3 viewports via a tabbed menu (see top left of the figure): left tab, classic GMV with the viewport limited to the contiguous United States (Figure 1); center tab, expanded GMV covering both contiguous United States and Alaska (left), right tab: Alaska only (right). Click on each image to play the corresponding GMV).
by Manoch Bahavar (IRIS Data Management Center) and Chad Trabant (IRIS DMC)


