New Web Interfaces: the Metadata Aggregator (MDA) and Google Map Service
Introduction
Occasionally applications built for internal use are deemed useful to the community at large and released. We are pleased to introduce you to two such applications, one is the MetaData Aggregator (MDA) and the other is the Google Map Service. Both of these are web interfaces presenting information from our internal database of metadata. While interesting for data users these interfaces should be especially interesting for network operators or anyone else who has submitted metadata to the IRIS DMC.
The original motivation for development of these tools was the USArray component of EarthScope, and the dynamic nature of the metadata. With the deployment of USArray stations in high gear, a way to review and perform basic quality control of the metadata was necessary.
A primary design goal for these interfaces was to simply conjoin, from the relational database at the IRIS DMC, all of the key information about a network, station or channel in as few mouse clicks as possible. The MDA is a sort of browser for all SEED data in our database allowing the user to surf through it using only a mouse or snap directly to the desired information with very minimal typing. The Google Map Service adds a mapping component for either single stations or entire networks or virtual networks. While these two applications are tightly integrated, each is a useful interface in their own right. Both of these tools are virtual network aware, meaning that a virtual network code can be used in place of a SEED network code. Neither of these constitutes new request mechanisms, but simply better windows on IRIS DMC holdings.
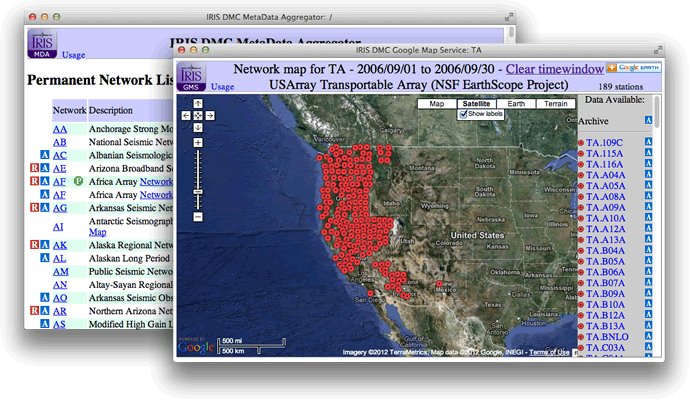
The MetaData Aggregator (MDA)
Communicating directly with the IRIS DMCs Oracle database the MDA provides a combination of key metadata parameters in a fast and useful way. Since each page generated by the MDA is a result of a query of the database the information is always the most current the DMC has. In addition to SEED metadata parameters the MDA will present, where appropriate, details such as data availability, virtual network affiliations, response curves and links to dynamic maps and data access information. This interface is heavily used internally and is becoming popular with network operators or anyone else submitting SEED metadata to verify that metadata they submitted has been loaded into our database and identify missing or outdated information.
There are five levels of output: network list, network, station, location and channel. Each of these follows the hierarchy of SEED naming convention and embedded hypertext links allow the traversal of the entire hierarchy using only mouse clicks. The selection or query parameters are specified directly in the URI of this web service making it very easy to jump directly to the output you desire simply by typing in the location bar of your web browser.
To get started you can get visit http://ds.iris.edu/mda/ and be presented with a list of all the networks and virtual networks in our database (see screen shot below). This top-level list includes the network start and end years along with the number of stations for which we have metadata. Also note the data availability icons next to each row in the table, these icons indicate whether we have data for this network in either the real-time systems or archive. By holding your mouse over these icons a tooltip should appear with a message indicating the time range for available data. The icons are often clickable and will take you to the next level of output.
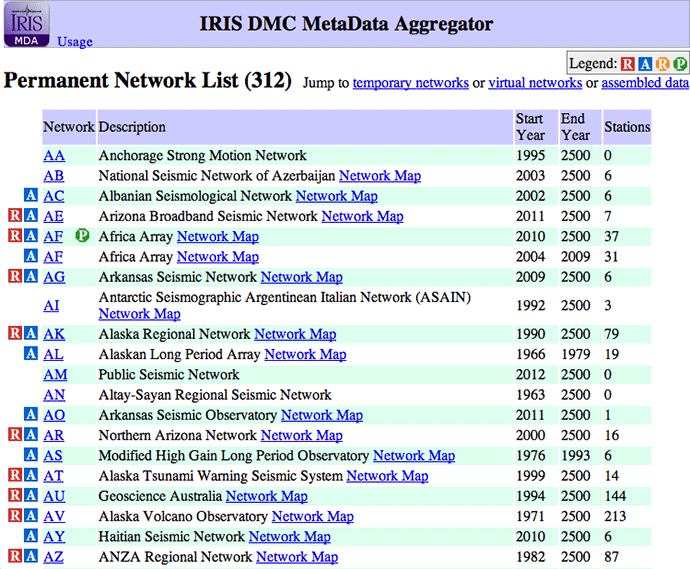
At any time you may either click the “Usage” link in the upper left corner or visit http://ds.iris.edu/mda/help to get the current usage information.
Please note: the IRIS DMC is the perpetual archive for the International Federation of Digital Seismograph Networks, but currently not all registered networks submit data to the IRIS DMC, and may collaborate with IRIS within the Networked Data Center concept (http://ds.iris.edu/manuals/netdc/intro.htm). This explains why we have networks listed but have no stations at the DMC.
Each level of output includes links up or down in the hierarchy of SEED metadata. For example, from the network list level it is possible to click on a network code and get to the summary for the network in question where it is possible to click on a location id or channel code and get to those summaries.
It is also possible to specify network code, station code, location id and/or channel code directly in the URI (the location bar of your browser). For example, adding “TA” to the end of the base MDA URI to get http://ds.iris.edu/mda/TA will return a page summarizing the USArray Transportable Array network including a list of stations and data availability.
In addition to specifying the network, station, location and channel, a timewindow parameter is also recognized. This allows limiting the selected data to a specific time range. This could be used to limit the network summary to specific years in order to summarize a specific temporary, PASSCAL-style, deployment, for example to see the Mongolia-Baikal Lithospheric Transect experiment deployed in 2003 try this:
http://ds.iris.edu/mda/XY?timewindow=2003-2003
Or it is possible to summarize the IU network for stations running in January of 1992 with this:
http://ds.iris.edu/mda/IU?timewindow=1992/1/1-1992/1/31
Please consult the usage information for more details.
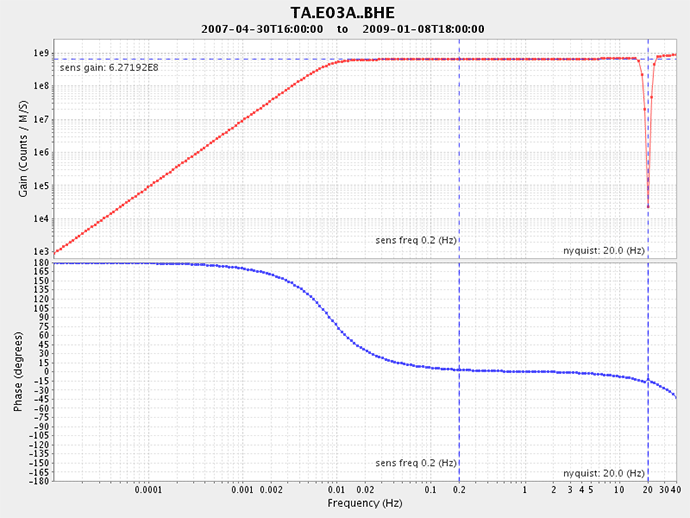
At the channel level output the MDA will return many details for the channel including coordinates, orientation, sampling rate, instrument description, units, data availability and a plot of frequency and phase response:
Every page returned by the MDA will include appropriate links to the Google Map Service (discussed in the next section) allowing dynamic maps of networks or single stations.
Google Map Service (GMS)
Requesting data directly from the IRIS DMC Oracle database the GMS creates dynamic station maps that can be panned and zoomed. While tightly integrated with the MetaData Aggregator the GMS is a separate and useful service on it’s own.
The GMS can produce network, single station or arbitrary station set maps. With syntax similar to the MDA, network and station maps can be requested simply by including network or station code in the URI. Selecting stations based on other criteria is possible using the supported input parameters including: location ids, channel codes, min or max latitude, min or max longitude and a couple of time range limiters. Further description of these parameters and example usage is always available here: http://ds.iris.edu/gmap/help.
For example to request a map of the current TA network stations try: http://ds.iris.edu/gmap/TA and you get this:
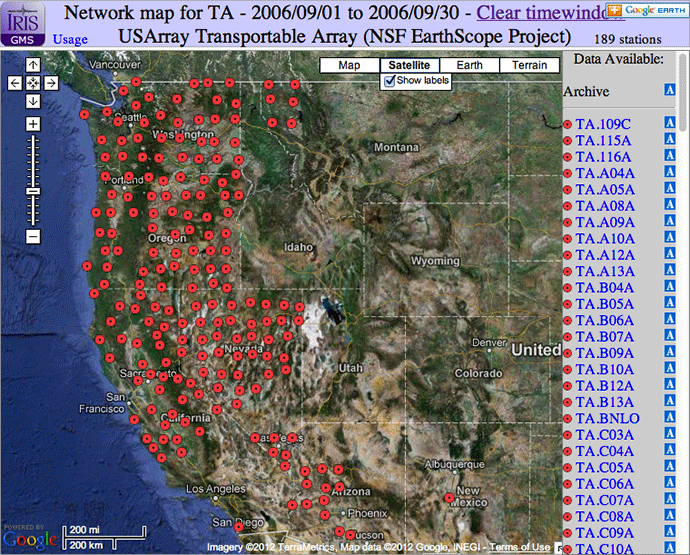
Each station symbol is clickable and when clicked will open a small information window with basic details about the station and a link to “More information”. The link to more information goes to the station level output of the MetaData Aggregator discussed in the previous section. As an example by clicking the symbol for TA network station A04A on the above map the information window looks like this:
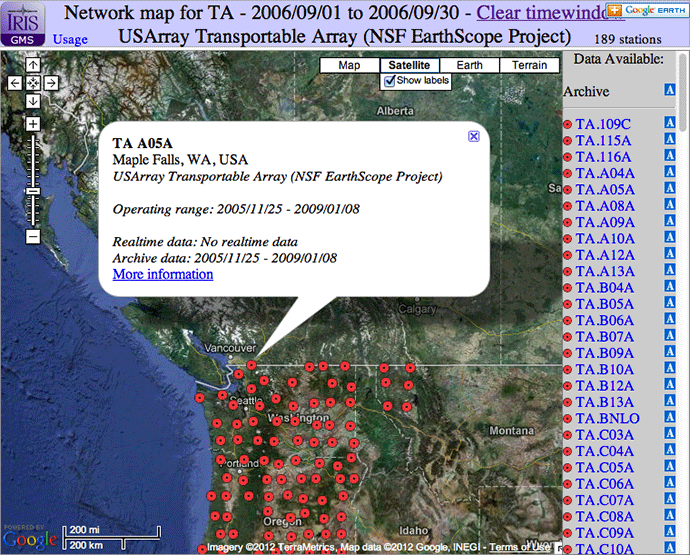
Each station symbol also has a tooltip that appears when you hold your mouse over the symbol (may not work in older browsers, see Fig. 5 above).
Note the sidebar on the left including a list of all the stations plotted on the map where each station is a hyperlink that, when clicked, will bring up that station’s information window. Also when the mouse cursor is over a station entry in the sidebar a ring is plotted around the matching station symbol on the map.
Using input parameters other than network and station it is possible to create a map with arbitrary station sets such as geographic area, or limited to stations with specific channels, etc.; please check out the usage message for further examples.
Finally, a Google Earth icon in the upper right corner is a link that will download the displayed station set as data used by Google Earth. What is returned is a Network Link that will always get the most current information from IRIS.
by Chad Trabant (IRIS DMC) and Rick Benson (IRIS Data Management Center)


