Special Event:
Chelyabinsk, Russia bolide (meteor)
Posted:Last updated:
This Special Event web page is intended to provide direct links to and images of
data and materials available from SAGE programs and preliminary research results
from the seismology community. We welcome any additional contributions
containing original content that might
be of interest to the research community. Please
send them to the email address listed below.
SAGE does not necessarily endorse the views or scientific validity of the posted items.
The meteor strike in Siberia was reported as 9:20am local, about UTC 03:22 Feb 15, 2013. Approx Lat-Lon: 55.15 N 61.41 E
Note:
All scientific contributions addressed to the community will be forwarded to the special-events mailing list.
If you DO NOT want your email being forwarded, please address it to SAGE or explicitly write
do not forward.
Figure 1: A quick record section for the Chelyabinsk event on the LDFUSArray barometers. The black line is a nominal 300 m/s move out curve at the approximate explosion origin. Normalized traces filtered above 120 s. (Rick Aster, New Mexico Tech)
Figure 2: Here is a quick plot of the surface waves generated by the Russia meteor explosion and recorded by the Global Seismic Network. The seismograms are band-pass-filtered between 10 to 100 s, and show clear Rayleigh waves recorded up to 2000 km! (Zhigang Peng, Georgia Tech)
Figure 3: Quick comparison of the Feb 15th meteor explosion near Chelyabinsk, Russia and the Feb. 12 North Korean nuclear explosion recorded a few hundred kilometers away. The top panel shows raw data, middle low-pass filtered below 10s, and bottom high-pass above 1 s. Because of a lack of coupling to the ground for the meteor explosion, only long period signals are recorded at long-range distances. (contributed by Zhigang Peng, Georgia Tech)
Figure 4: Vertical component seismogram from nearby station ARU filtered top: 10-100 s, middle: 1-8 s, bottom: >5Hz. The >5Hz signal abruptly shuts off coincidentally at around the time of the meteor. This is likely cultural since this is observed at other times on this station. Time is relative to 03:22 UTC. (Stephen Hernandez, UCSC)
Figure 5: Spectrograms from two USArray infrasound stations, LDF channel, and seismograms, BHZ channel, filtered between 0.02 – 0.12 Hz (Catherine Degroot-Hedlin, UCSD)
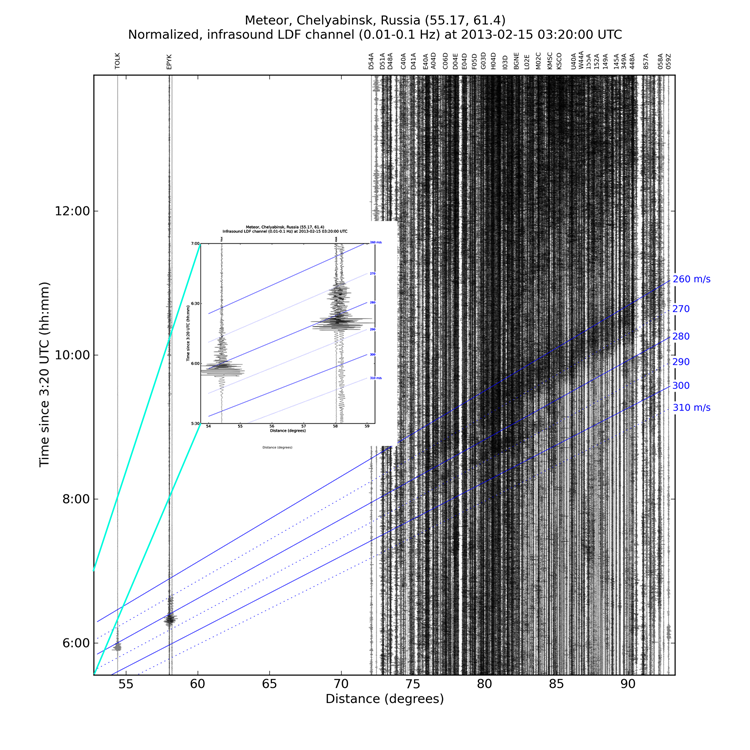
Figure 6: Record section using all USArray stations: LHZ channel. Traces are filtered 0.01-0.1 Hz with amplitudes normalized to peak amplitude for each trace. Inset image shows the Alaska TA stations. (IRISDMC)
Figure 7: Map for USArray infrasound, LDF channel, record sections filtered between 0.02-0.12 Hz. (Catherin Degroot-Hedlin, UCSD)
Figure 8:USArray infrasound, LDF channel, record section 1 filtered between 0.02-0.12 Hz. (Catherin Degroot-Hedlin, UCSD)
Figure 9:USArray infrasound, LDF channel, record section 2 filtered between 0.02-0.12 Hz. (Catherin Degroot-Hedlin, UCSD)
Figure 10:USArray infrasound, LDF channel, record section 3 filtered between 0.02-0.12 Hz. (Catherin Degroot-Hedlin, UCSD)
Figure 11:USArray infrasound, LDF channel, record section 4 filtered between 0.02-0.12 Hz. (Catherin Degroot-Hedlin, UCSD)
Figure 12:USArray infrasound, LDF channel, record section 5 filtered between 0.02-0.12 Hz. (Catherin Degroot-Hedlin, UCSD)
Figure 13:USArray infrasound, LDF channel, record section 6 filtered between 0.02-0.12 Hz. (Catherin Degroot-Hedlin, UCSD)
Figure 14:USArray infrasound, LDF channel, record section 7 filtered between 0.02-0.12 Hz. (Catherin Degroot-Hedlin, UCSD)
Figure 15:USArray infrasound, LDF channel, record section 8 filtered between 0.02-0.12 Hz. (Catherin Degroot-Hedlin, UCSD)
Figure 16: Russian bolide record section of vertical ground motion (BHZ channel) using a narrow bandpass filter around 32 s with phases from a Tonga M5.8 event (20 minutes before bolide) marked. The shock wave from the bolide’s high altitude explosion shook (coupled to) the ground and generated a strong surface (Rayleigh) wave. The stations used are between 120-150 degrees from the Tonga event. The strong arrivals after the red triangles are PKP arrivals (see Fig 18) from the Tonga event. (IRISDMC) Zip file of BHZ record section of data from Russian bolide using different filters
Figure 18: Tonga earthquake record section of vertical ground motion (BHZ channel) using a narrow bandpass filter around 16 s with major phases marked. Predicted arrival times of the Russian bolide using a 3.5 km/s reference velocity are marked in magenta. (IRISDMC) Zip file of BHZ record section of data from Tonga event using different filters
Sonification of a seismic & infrasound recordings of the meteor explosion
Video 1: The above video shows seismic signals of the 2013/02/15 Russian Meteor Impact near Chelyabinsk recorded at station II.ARU. It appears that there are some seismic signals at -50 s right before the major impact, something worth to examine further. Also the 5 Hz signals is likely some local man-made noise. (Zhigang Peng, Georgia Tech).
Video 2: SeisSound of the meteor recorded at USArray station TA.TOLK on the infrasound channel (code: BDF) . (IRIS DMC) SeisSound archive