


This Special Event web page is intended to provide direct links to and images of data and materials available from SAGE programs and preliminary research results from the seismology community. We welcome any additional contributions containing original content that might be of interest to the research community. Please send them to the email address listed below.
SAGE does not necessarily endorse the views or scientific validity of the posted items.
Hurricane Irma is among the most powerful hurricanes ever recorded (as measured by wind speed). Tracking of Irma logs it at speed of 25 knots (28.8 mph) on August 27 and its speed was more than 160 knots (184.1 mph) on September 5th. Irma is expected to arrive near the Florida coast by Saturday September 9, 2017.
Email contributions to:
special-events@lists.ds.iris.edu
Note:
All scientific contributions addressed to the community will be forwarded to the special-events mailing list.
If you DO NOT want your email being forwarded, please address it to SAGE or explicitly write
do not forward.
Quick Links
Email contributions to: 
special-events@lists.ds.iris.edu
Links 


- US Naval Research Laboratory, Marine Meteorology — Irma track data KML
- US Naval Research Laboratory, Marine Meteorology — Irma track data as text


Figures 
[NOAA, National Hurricane Center] Tropical-Storm-Force wind speed probabilities.
[IRIS DMC Data Products Team] *NOTE: This image was produced based on the available data 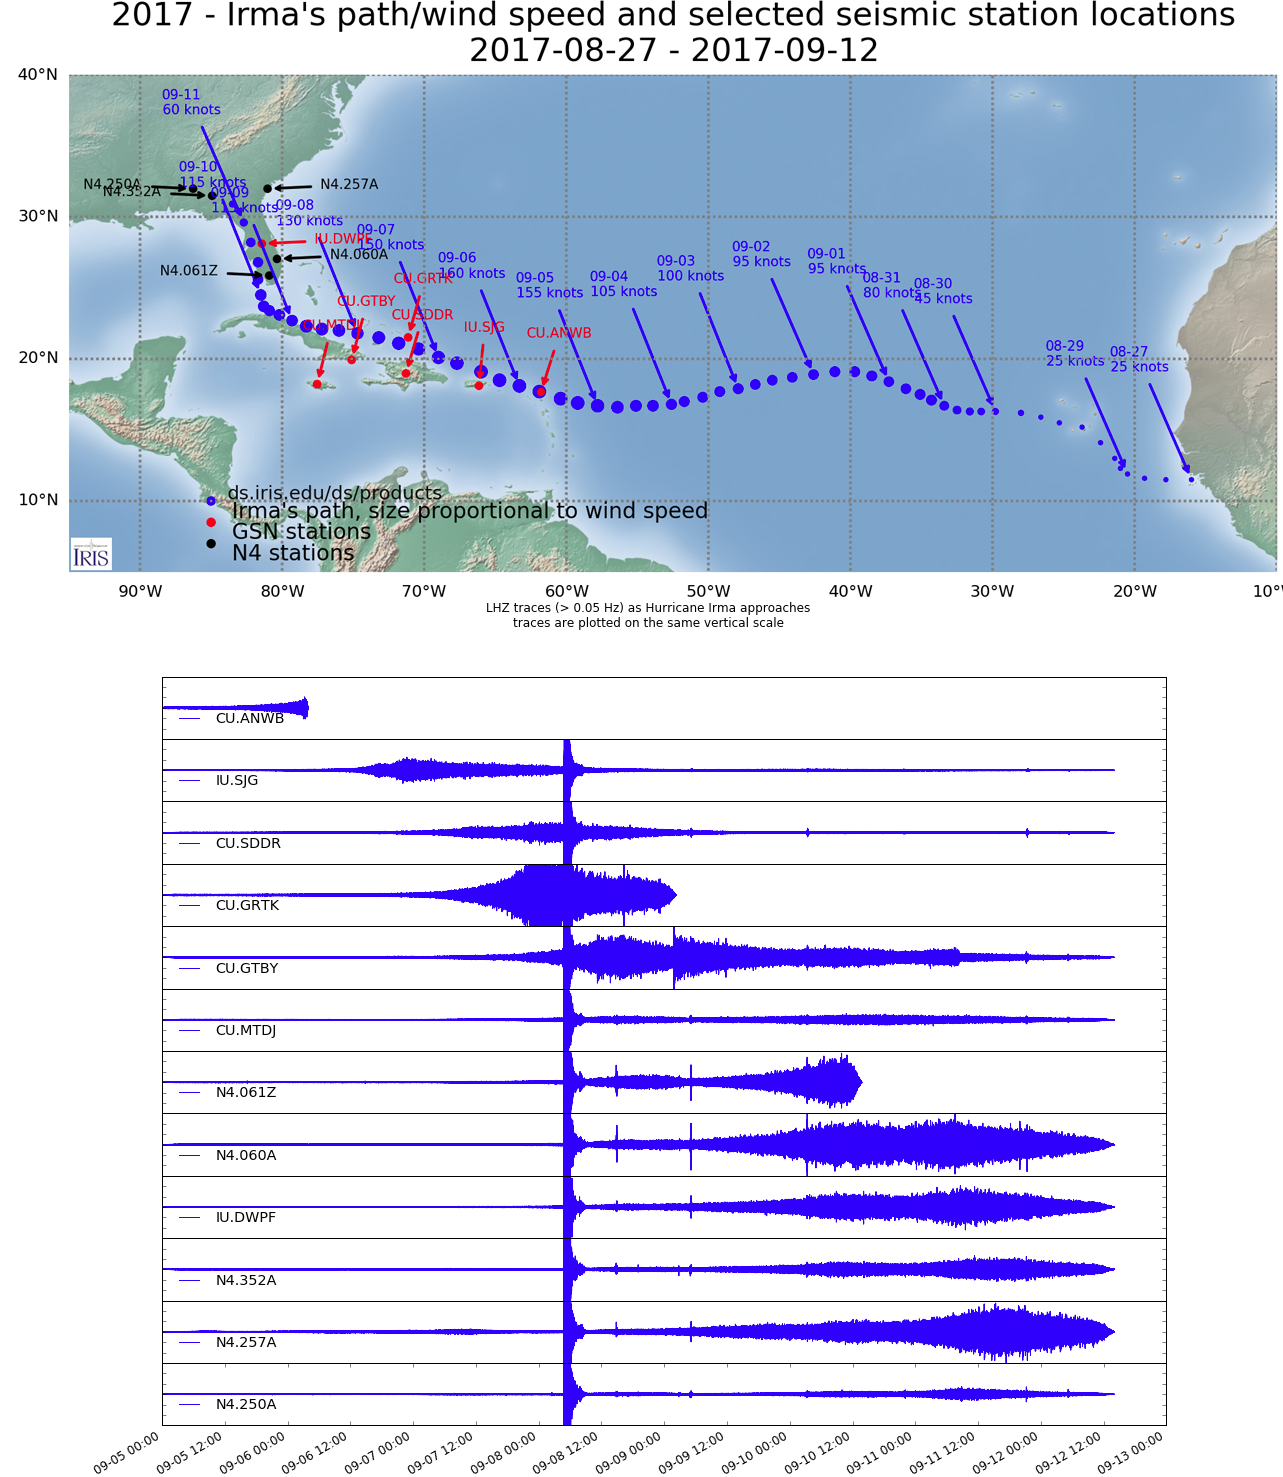
up to 2017-09-12 14:00 UTC*. (top) Map shows path of Hurricane Irma as blue circles with
size proportional to wind speed. Location of selected GSN stations (red) and N4 network stations
(black) are also shown. (bottom) LHZ traces from the stations shown on the above map for
frequencies > 0.05 Hz. Clipped arrivals (trace scaling) are due to the M8.1 earthquake near coast
of Chiapas, Mexico at 04:49:21 UTC on 09-08.
[Jonathan W Mies, The University of Tennessee at Chattanooga] This is our complete microseism 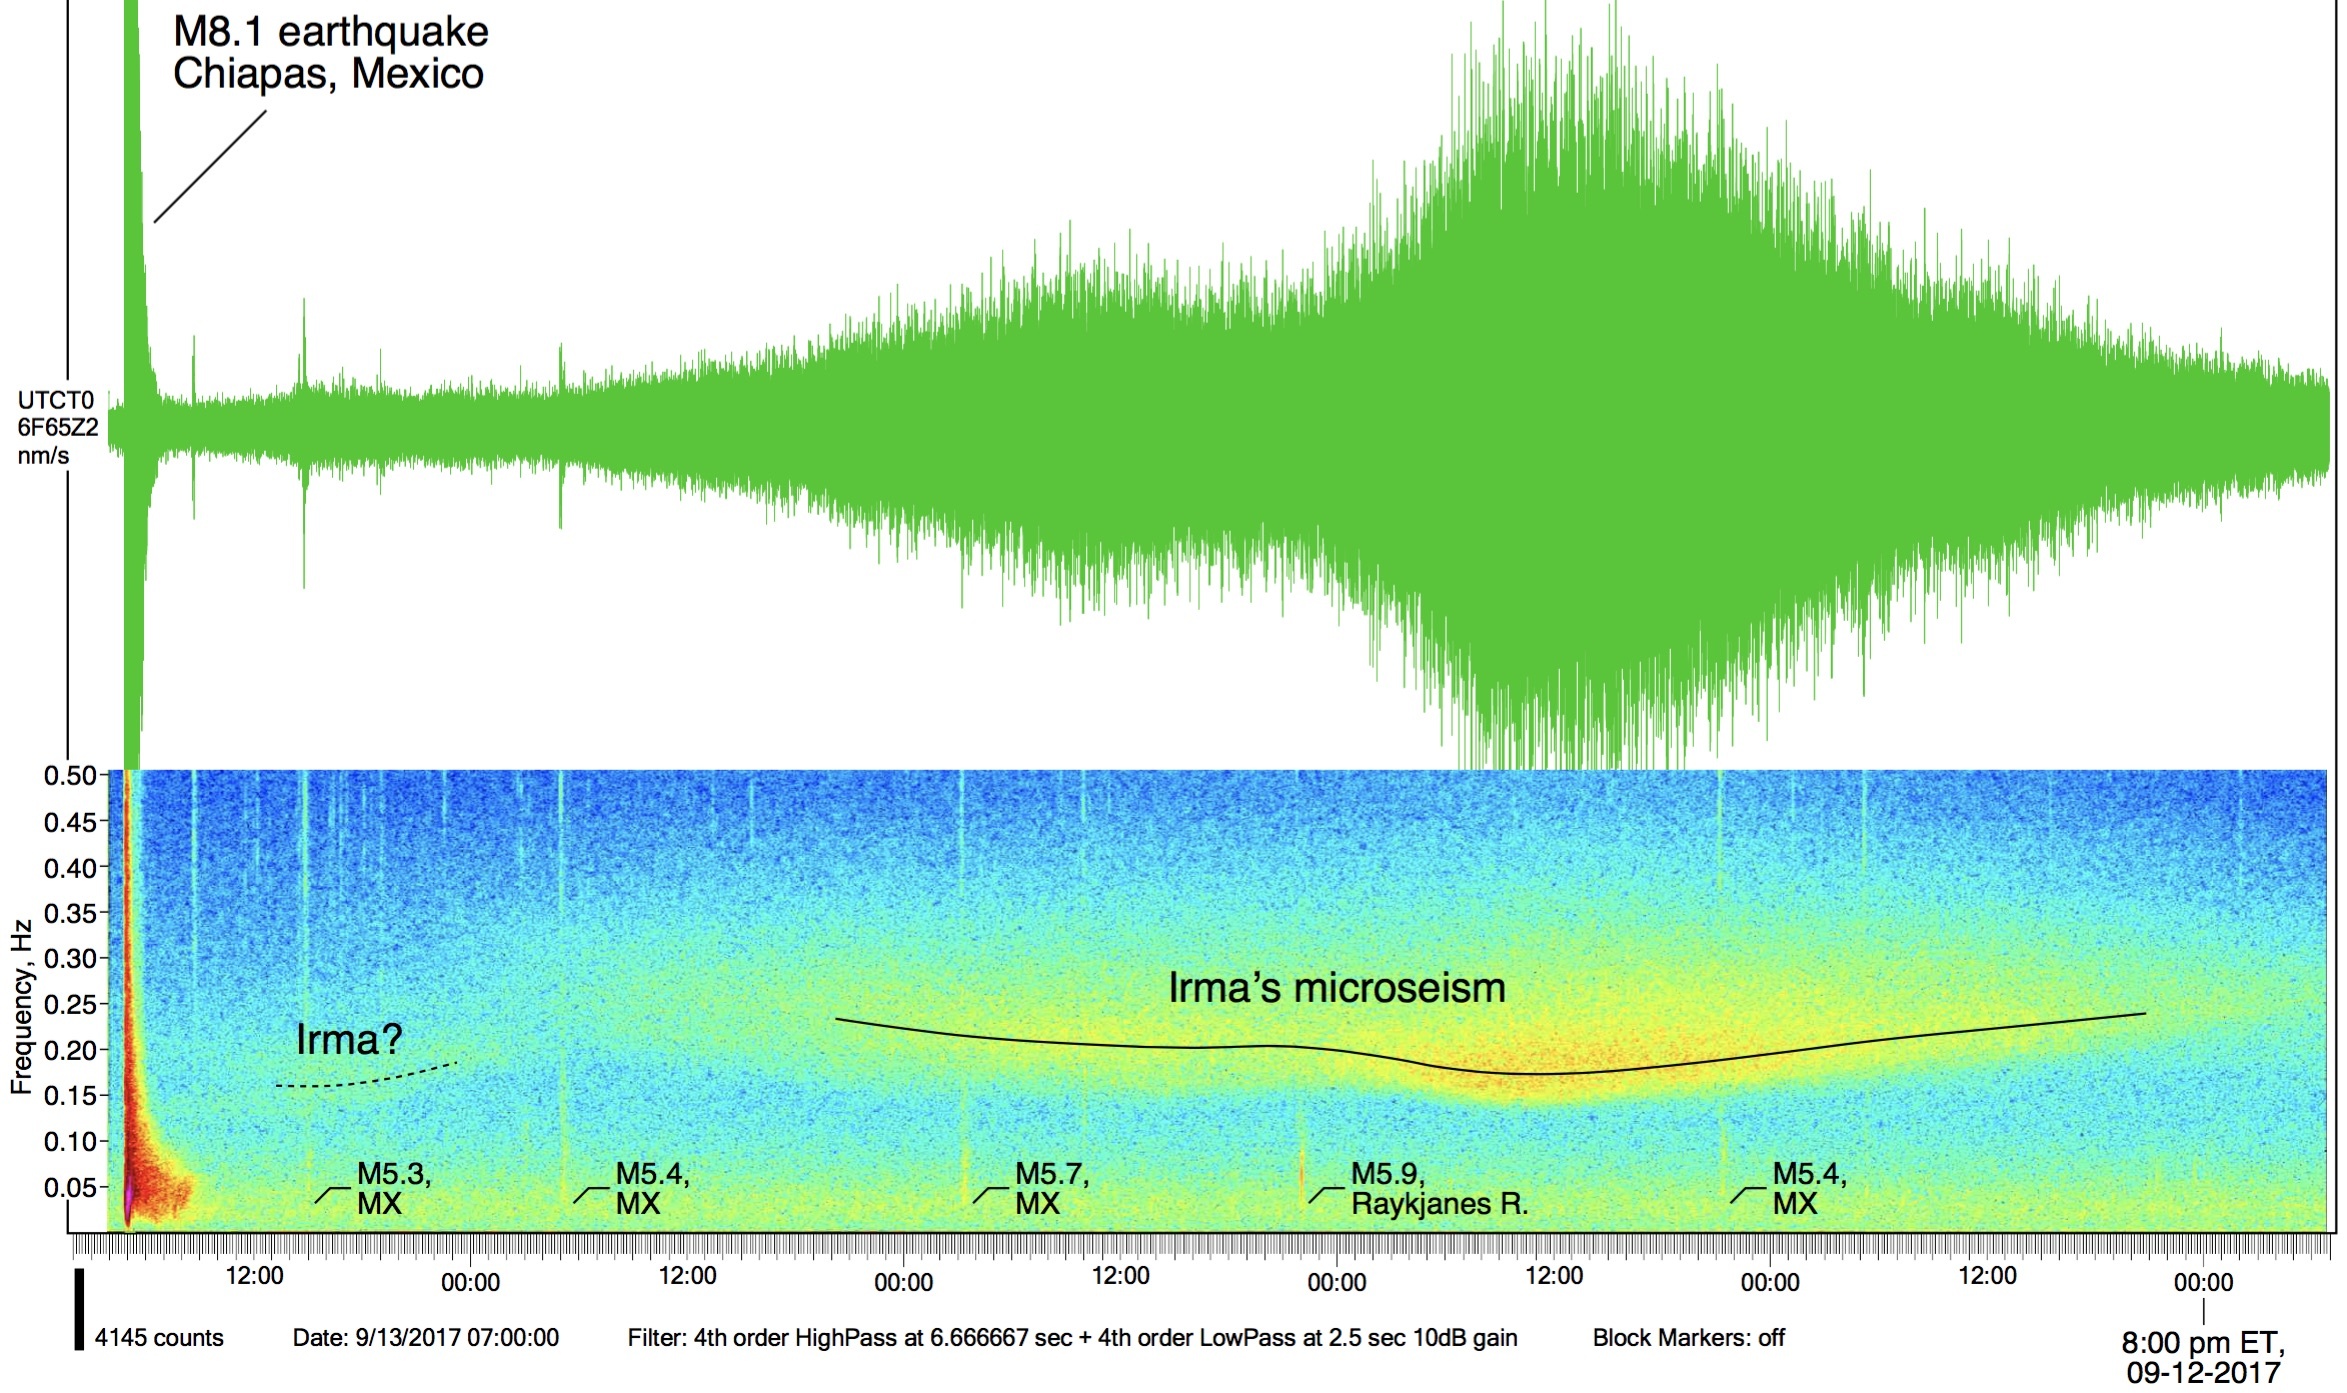
from Irma, 09-08-2017 04:00 UTC to 09-13-2017 07:00 UTC, recorded at Chattanooga, TN.
[Robert Anthony, USGS] Ground acceleration spectrogram for the vertical component of SDDR 
(Presa de Sabenta, Dominican Republic) from 28 August to 8 September 2017 (UTC). Power
Spectral Density (PSD; rel. 1 (m/s2)2/Hz) estimates were attained using the IRIS Noise Tool Kit
(NTK) using 2-hour windows with 50% overlap and 1/16th octave smoothing. The M 8.1 Mexico
earthquake along with a local (~100 km) M 4.3 event in Haiti, and a 4.5 in the northeast
Dominican Republic are noted. Two additional earthquakes (~M 4) located to the east of the
Dominican Republic can be seen as transient increases in power between ~1-5 Hz. Station
SDDR is located ~100 m from Sabana Yegua Dam and pump noise is quite prevalent at this
station. It appears the dam pumps are running continuously as Hurricane Irma passes the
Dominican Republic, likely in response to increased runoff into the reservoir.
Videos & Animations 

Heliplots 
[IRIS, timeseriesplot service] Station CU ANWB — Willy Bob, Antigua and Barbuda
Heliplot starting at 2017-09-05 06:00 UTC showing increased background
noise as Irma approaches and its eventual outage (click on image to access the IRIS
timeseriesplot service).
[IRIS, timeseriesplot service] Station IU SJG — San Juan, Puerto Rico
Heliplot starting at 2017-09-05 00:00 UTC showing increased background
noise as Irma approaches (click on image to access the IRIS timeseriesplot service).
[IRIS, timeseriesplot service] Station CU SDDR — Presa de Sabenta, Dominican Republico
Heliplot starting at 2017-09-06 UTC showing increased background
noise as Irma approaches (click on image to access the IRIS timeseriesplot service).
Extremely large amplitudes near the end of the record section are due to the
M8.1 earthquake near coast of Chiapas, Mexico at 04:49:21 UTC on 09-08 and the plot scaling.
[IRIS, timeseriesplot service] Station CU GRTK — Grand Turk, Turks and Caicos Islands
Heliplot starting at 2017-09-07 00:00 UTC showing increased background
noise as Irma approaches and its eventual outage (click on image to access the IRIS
timeseriesplot service).
[IRIS, timeseriesplot service] Station CU GTBY — Guantanamo Bay, Cuba
Heliplot starting at 2017-09-06 UTC showing increased background
noise as Irma approaches (click on image to access the IRIS timeseriesplot service).
Extremely large amplitudes near the end of the record section are due to the
M8.1 earthquake near coast of Chiapas, Mexico at 04:49:21 UTC on 09-08 and the plot scaling.
Related Content
These other pages were tagged similarly:
- No related content available


