


Posted on
Contributed by Mary Templeton
Affiliation IRIS DMC
This article is a small compendium of waveform features:
- background noise
- digitizer noise
- diurnal thermal noise
- local earthquake
- teleseismic earthquake
- gaps
- harmonic ringing
- mass against stops
- mass recenter
- reservoir pump
- step calibration
- storm
and their expression in power spectral density (PSD) plots. It’s intended to serve as a growing reference for interpreting PSDs. The figures shown here (from the pqlx software developed by Richard Boaz) include:
- a one-hour (usually) trace window and
- its corresponding PSD.
The Peterson new high and low noise model curves are displayed on the PSD plots for reference (grey lines).
At the end of the article is a Self Quiz showing each PSD so you can try naming the waveform that generated it. Clicking on the PSD displays the answer.
Background Noise
ISCO is an example of a quiet site in a cave with minimal background noise:
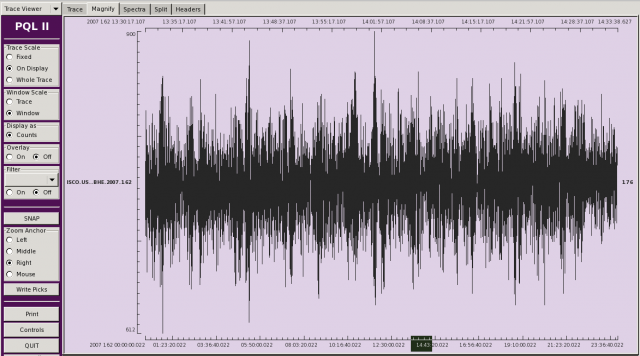
The PSD for this quiet site shows low power, even at long periods on horizontal channels:

Digitizer Noise
For a few days, the sensor at RLMT went out and the station recorded digitizer noise:

The PSD reflects that the amplitudes are only a few counts and vary from sample to sample:

The response is similar to a channel mass resting against the stops.
Diurnal Thermal Noise
SRU resides in a near-surface vault and shows long period diurnal thermal noise during daylight hours (~14:00-02:00 UTC). The PSD below shows the SRU during its quieter times:

The bars below show time of day corresponding to the PSD. All curves represent local night time:

The trace shows night time background noise levels of ~300 counts:

The next PSD below shows the SRU during its noisier times:

All curves for this PSD represent local day time:

The trace shows the large (~7000 count) long-period noise levels during the warm hours:

Local Earthquake
This local event:

is rich in short-period body waves:

Teleseism
PSD for these teleseismic surface waves:

is rich in long-period energy:

Gaps
A data gap maps as a line in a PSD plot with a slope of about 20 dB per decade. The line’s intercept depends on the amplitude difference across the gap. Gaps with larger amplitude offsets:

have larger intercepts (lie farther above the noise model curves):

than do gaps with smaller amplitude offsets:


Harmonic Ringing
The STS-2 at PASC is ringing at 80 seconds for some unknown reason. The trace below, which has been low-pass filtered below 1 second, illustrates this:

The corresponding PSD shows that energy near 80 seconds never falls below a certain level, even when the rest of the pass band is quiet:

Mass Against Stops
The trace below shows the pegging of a Guralp CMG-3T borehole mass recorded on a Q330:

This horizontal component began showing long period noise and drift followed by an episode of bouncing between both stops. This behavior may have coincided with a mass recenter attempt, but it’s unconfirmed. Large amplitude acausal spikes are recorded on this channel while the mass is against its stops:


When the spikes abate and the mass finally rests against a single stop, the channel records little or no seismic energy:

and the resulting PSD is low power and fairly white:

Mass Recenter
A mass recenter on an STS-2::

has this PSD signature:

Reservoir Pump
Station US.PKME lies in a state park near a water tank that supplies water for visitors. As the tank empties to a certain point, more water is pumped into the tank. The long period tilt on the horizontal channels of the seismic trace:

is probably a combination of the pump and loading at the tank. Its signature is evident at the long-period end of the PSD:

Step Calibration
Two step calibrations (boxcar function) on a Guralp CMG-3T:

have the following PSD signature:

Storm
Sunday June 3, 2007, a storm with heavy rains delayed flights along the US east coast and nearly rained out the baseball game between the New York Yankees and the Boston Red Sox. Storm-related noise swelled throughout the Julian day on the seismic trace below:

Data from the time window between the black vertical lines shows a large microseismic peak on its PSD:

relative to other PSDs from that week:

Self Quiz
See if you can name the waveform from the article that gave rise to each of the following PSDs. Clicking on the PSD reveals the answer; use your browser’s Back button to continue with the quiz.PSD 1

PSD 2

PSD 3

PSD 4

PSD 5

PSD 6

PSD 7

PSD 8

PSD 9

PSD 10

PSD 11

PSD 12

PSD 13

PSD 14


