Summary
Africa.ANT.Emry-etal.2018 is a 3-D isotropic shear-wave tomographic model of Africa and neighboring regions.
Quicklinks
Description
| Name | Africa.ANT.Emry-etal.2018 |
| Title | 3-D isotropic shear-wave model for Africa from full-wave ambient noise tomography |
| Type | 3-D Tomography Earth Model |
| Sub Type | Shear-wave velocity (km/s) |
| Year | 2018 |
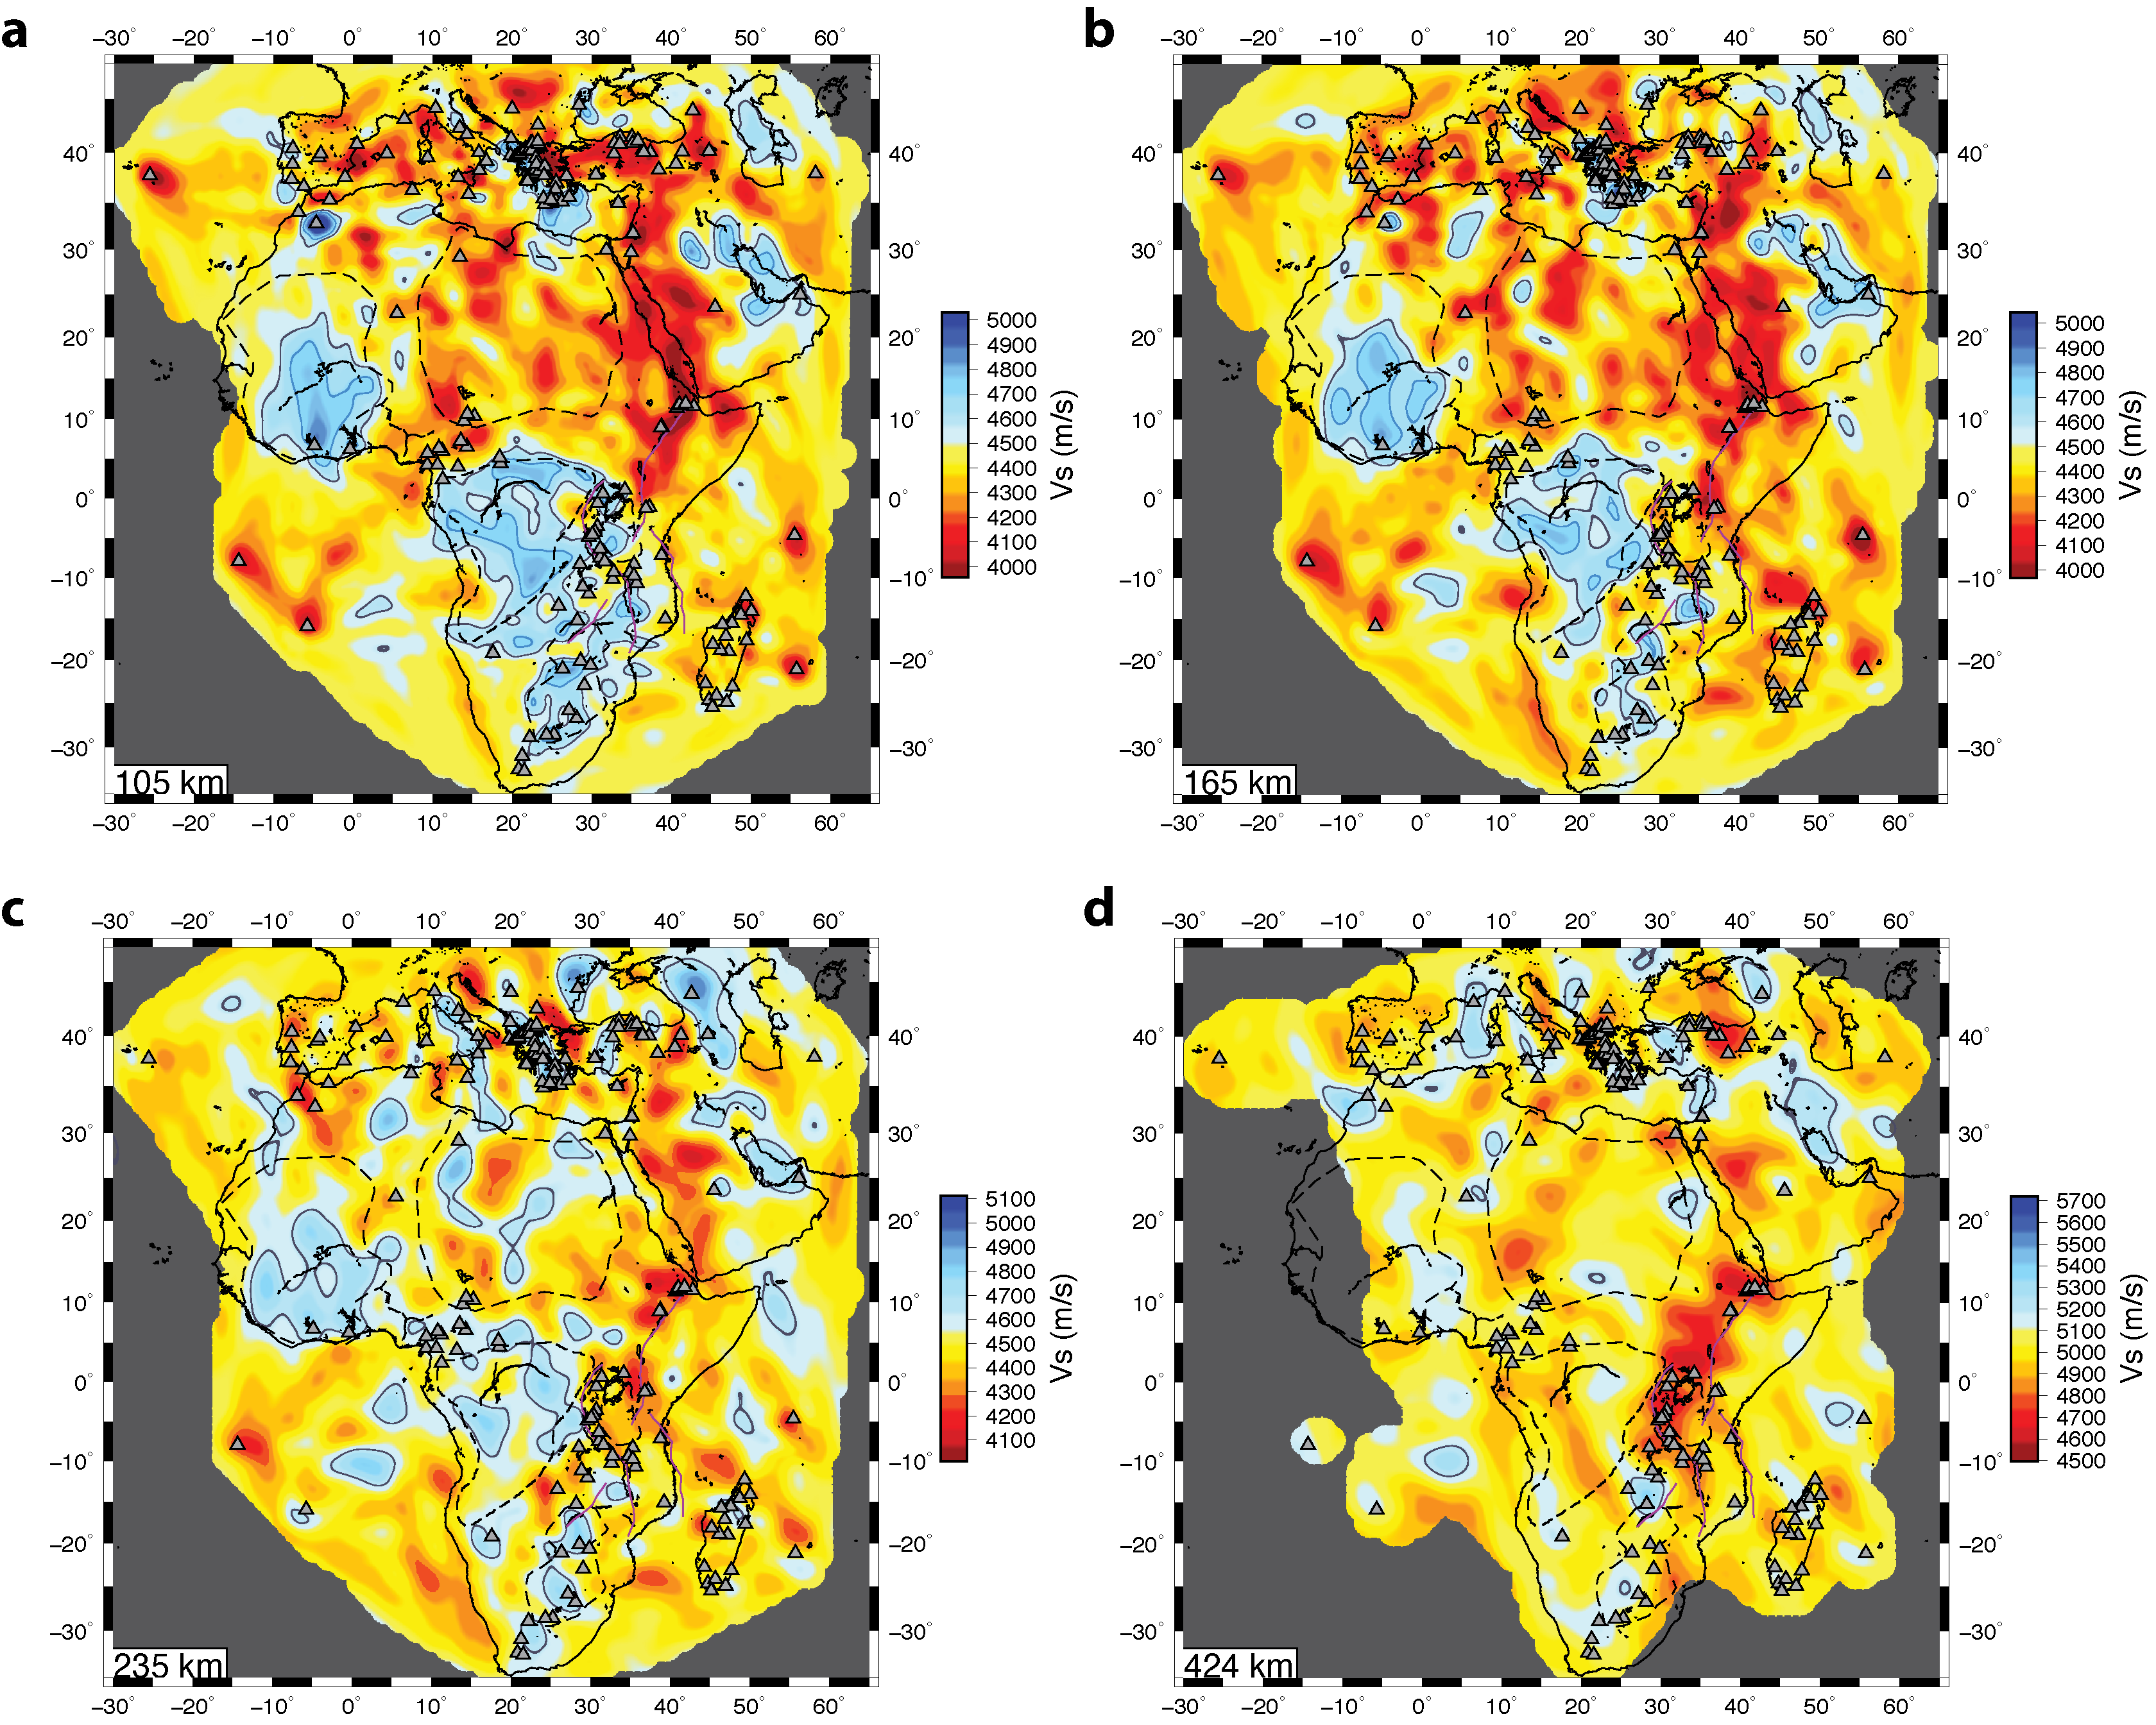
| Short Description | Africa.ANT.Emry-etal.2018 is a 3-D isotropic shear-wave tomographic model of Africa and neighboring regions. Model is constrained by long period (40-340 sec.) Rayleigh waves from empirical Green’s functions (EGF) extracted from cross-correlation between station pairs. Data are inverted using finite-difference full-waveform simulations to construct finite-frequency sensitivity kernels. Model is iteratively updated, and the contributed model provides results following the 9th iteration. Best model resolution is at depths of ~100-400 km. |
| Authors: | |
| Erica Emry | |
| Earth and Environmental Sciences | |
| New Mexico Tech | |
| Socorro, NM, USA | |
| Yang Shen | |
| Graduate School of Oceanography | |
| University of Rhode Island | |
| Narragansett, RI, USA | |
| Andrew Nyblade | |
| Department of Geosciences | |
| Pennsylvania State University | |
| University Park, PA, USA | |
| Ashton Flinders | |
| United States Geological Survey | |
| Menlo Park, CA, USA | |
| Xueyang Bao | |
| Graduate School of Oceanography | |
| University of Rhode Island | |
| Narragansett, RI, USA | |
| Previous Model | None |
| Reference Model | Starting model was CRUST1.0 (Laske et al., 2013) underlain by AK135 (Kennett et al., 1995); the final model is provided as absolute shear-wave velocity (km/s). |
| Model Download | Africa.ANT.Emry-etal.2018_kmps.nc (see metadata ), is the netCDF file for the model |
| Model Homepage | |
| Depth Coverage | Included in the netCDF are depths from 33-614 km; best model resolution is at ~100-400 km. |
| Area | Africa and parts of the Arabian Peninsula and Mediterranean (latitude: -41.4° to 51.6°, longitude: -32.6° to 66.4°). |
| Data Set Description | Ambient noise data were collected from 851 seismic stations located throughout Africa, the Middle East, and Southern Europe, and station-station cross-correlation was used to retrieve empirical Green’s functions (EGFs). EGFs with Rayleigh wave signal-to-noise ratio (SNR) > 5 were for 414 stations at periods of 7-340 sec. Data with SNR > 5 at periods of 40-340 sec periods (from 186 seismic stations) were used to invert for this upper-mantle model. |
| Model Resolution: | Model inversion blocks are 1°x1° in the horizontal direction. Inversion block size increases with model depth in the vertical direction, from 11-34 km spacing. The best resolution exists at upper mantle depths (~100-400 km) between 25°S to 45°N and 0 to 50° E. |

and d) 424 km. The color bar is set to ±12% of AK135 global average Earth model (Kennett et al., 1995)
at each depth. The model is masked by gray where it is not expected to have sensitivity to structure. Gray
triangles show seismic stations for which high-SNR EGFs contributed to the model. Black lines outline coast,
lakes, and major rivers. In a-d), gray contour lines indicate where shear velocities are 1.7% fast in
comparison to the global average. In a and b, blue contour lines indicate where shear velocities are equal
to 4.7 km/sec. Dashed black lines correspond to the boundaries of cratons and metacratons and thin,
purple lines show segments of the EARS.
Citations and DOIs
To cite the original work behind this Earth model:
- Emry, E. L., Shen, Y., Nyblade, A. A., Flinders, A., & Bao, X. (2018). Upper mantle Earth structure in Africa from full-wave ambient noise tomography. Geochemistry, Geophysics, Geosystems,19. https://doi.org/10.1029/2018GC007804
To cite IRIS DMC Data Products effort:
- Trabant, C., A. R. Hutko, M. Bahavar, R. Karstens, T. Ahern, and R. Aster (2012), Data Products at the IRIS DMC: Stepping Stones for Research and Other Applications, Seismological Research Letters, 83(5), 846–854, https://doi.org/10.1785/0220120032.
DOI for this EMC webpage:
References
- Kennett B.L.N., E.R. Engdahl and R. Buland. 1995. “Constraints on seismic velocities in the earth from travel times” Geophys. J. Int. 122:108-124.
- Laske, G., Masters., G., Ma, Z. and Pasyanos, M., Update on CRUST1.0 – A 1-degree Global Model of Earth’s Crust, Geophys. Res. Abstracts, 15, Abstract EGU2013-2658, 2013.
Credits
Model provided by Erica Emry
Timeline
- 2019-01-09
- online


