Summary
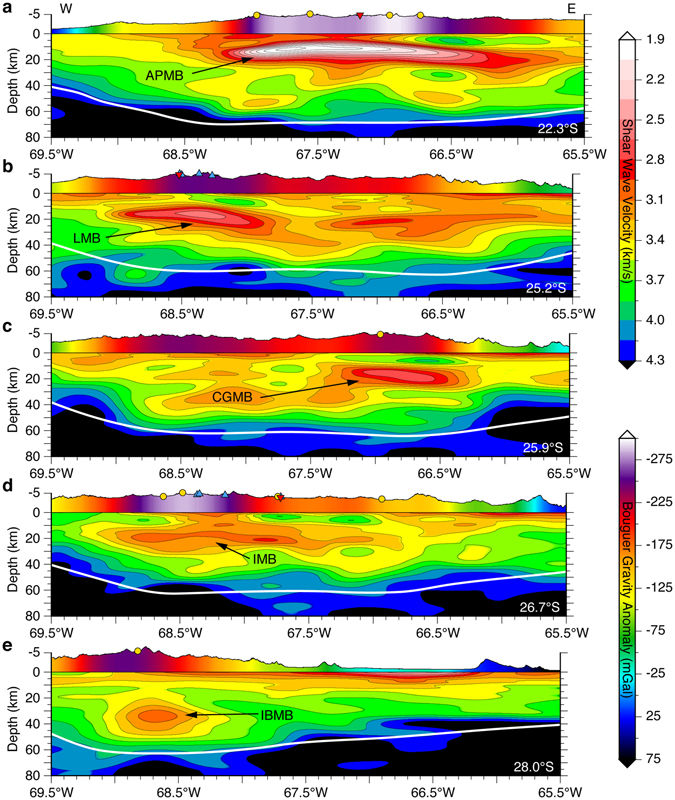
3D shear-wave velocity model of the Altiplano-Puna Volcanic Complex (APVC) and the Puna Plateau from the joint inversion of ambient noise tomography and receiver functions.
Quicklinks
Description
| Name | APVC+Puna.ANT+RF.Ward.2017 |
| Title | 3D shear-wave velocity model of the Altiplano-Puna Volcanic Complex (APVC) and the Puna Plateau from the joint inversion of ambient noise tomography and receiver functions. |
| Type | 3-D Tomography Earth Model |
| Sub Type | Shear-wave velocity (km/s) |
| Year | 2017 |
| Short Description | The model incorporates seismic data from an earlier ambient noise tomography study (Ward et al., 2013) to image the shear wave velocity structure of the Altiplano-Puna Volcanic Complex (APVC) and the Puna Plateau from the joint inversion of surface wave dispersion and receiver functions. Both broadband and short-period instruments are used to calculate the receiver functions used in the production of this model. |
| Authors: | |
| Kevin M. Ward | |
| Department of Geology and Geophysics | |
| The University of Utah | |
| 115 South 1460 East, Salt Lake City, UT 84112, USA | |
| Jonathan R. Delph | |
| Department of Earth Science | |
| Rice University | |
| 6100 Main Street, Houston, TX 77005, USA | |
| George Zandt, Susan L. Beck, and Mihai N. Ducea | |
| Department of Geosciences | |
| The University of Arizona | |
| 1040 E. 4th Street Tucson, AZ 85721, USA | |
| Previous Model | None |
| Reference Model | None |
| Model Download | APVC+Puna.ANT+RF.Ward.2017_kmps.nc (see metadata ), is the netCDF file for the model as a function of depth |
| Model Homepage | |
| Depth Coverage | 0 to 80 km (bsl) |
| Area | The southern Central Andean Plateau (latitude: 28.0°S/20.5°S, longitude: 69.5W°/65.5°W) |
| Data Set Description | [Ward et al., (2017)] The dataset includes the absolute S-wave velocity structure across the Altiplano-Puna Volcanic Complex (APVC) and the Puna Plateau from the joint inversion of ambient noise tomography and receiver functions. |

Citations and DOIs
To cite the original work behind this Earth model:
- Ward, K. M., Delph, J. R., Zandt, G., Beck, S. L., and Ducea, M. N., (2017), Magmatic evolution of a Cordilleran flare-up and its role in the creation of silicic crust, Scientific Reports. https://doi.org/10.1038/s41598-017-09015-5
To cite IRIS DMC Data Products effort:
- Trabant, C., A. R. Hutko, M. Bahavar, R. Karstens, T. Ahern, and R. Aster (2012), Data Products at the IRIS DMC: Stepping Stones for Research and Other Applications, Seismological Research Letters, 83(5), 846–854, https://doi.org/10.1785/0220120032.
DOI for this EMC webpage:
Credits
Model provided by Kevin M. Ward
Timeline
- 2017-08-23
- online


