Summary
The contributed Earth models to EMC are available for download from the model overview pages or IRIS’ Searchable Product Depository (SPUD) in netCDF (network Common Data Form) format. These models are compatible with those desktop visualization systems that support netCDF data files. This page provides a short introduction on installation and model loading for some free Java-based desktop applications that allow 3-D visualization of complex solid earth data.
Quicklinks
Description
The IRIS Earth Model Collaboration (EMC) ParaView Plug-ins
The EMC-ParaView Plug-ins bundle is set of Python programmable filters/sources to allow ParaView, an open-source, multi-platform data analysis and visualization application (on macOS® and Linux® platforms), to display EMC netCDF models along with other auxiliary Earth data:
Read Earth Models
|
Display USGS Slab 1.0 models (link) |
Surface Elevation Data
|
Draw Boundaries
|
Volcano Locations
|
Earthquake Locations
|
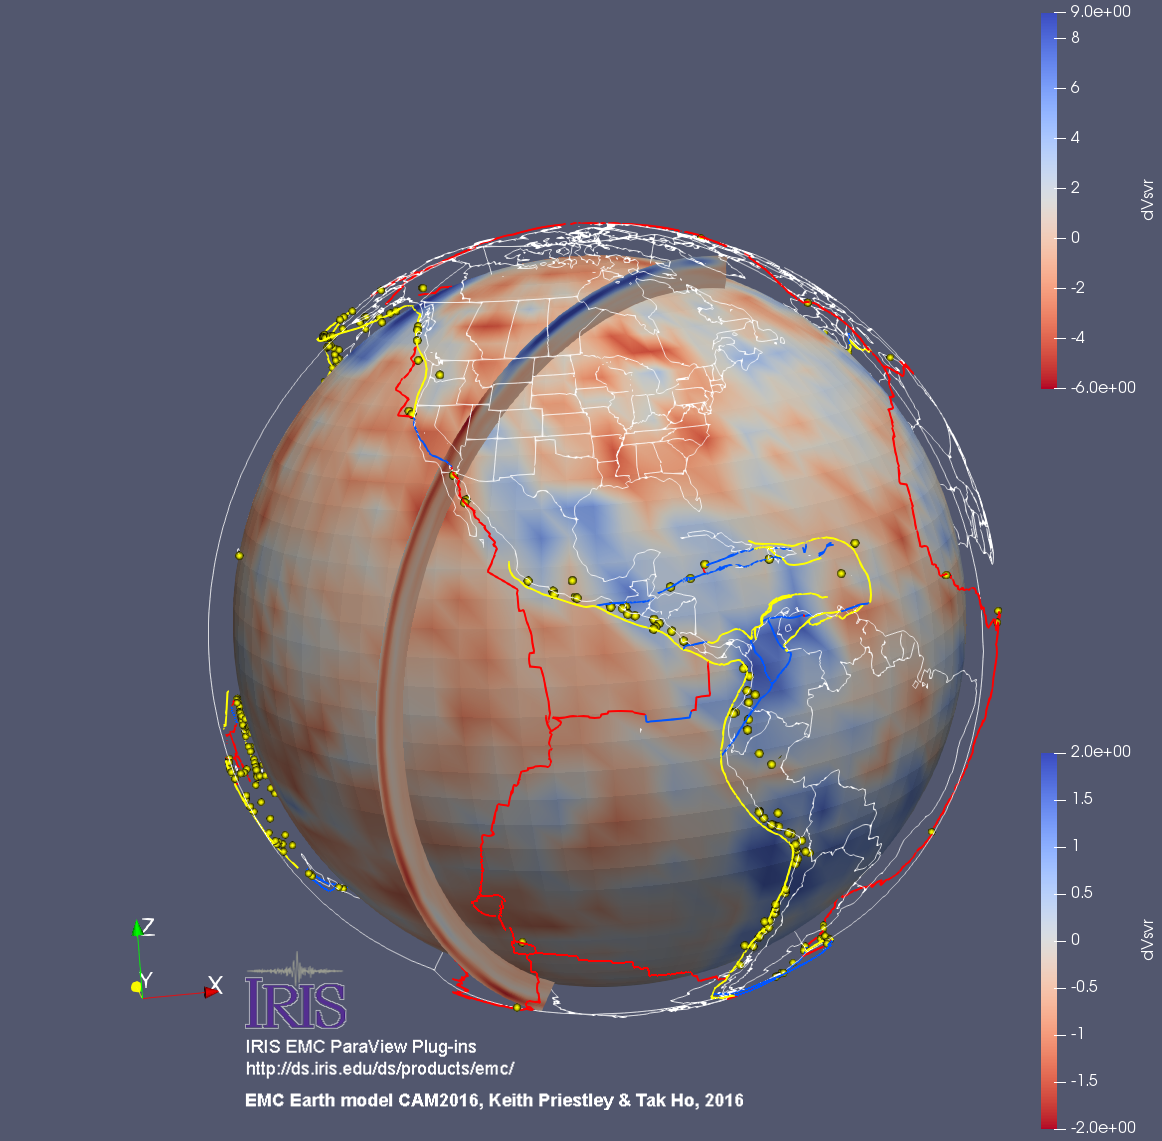
tomography model by Keith Priestley and Tak Ho, 2016. The image displays dVsvr,
perturbation of the vertical component shear wave speed w/t reference model (rmod),
at the depth of 500 km. Coastline, plate boundaries earthquake locations and a vertical
slice of the model are also displayed.
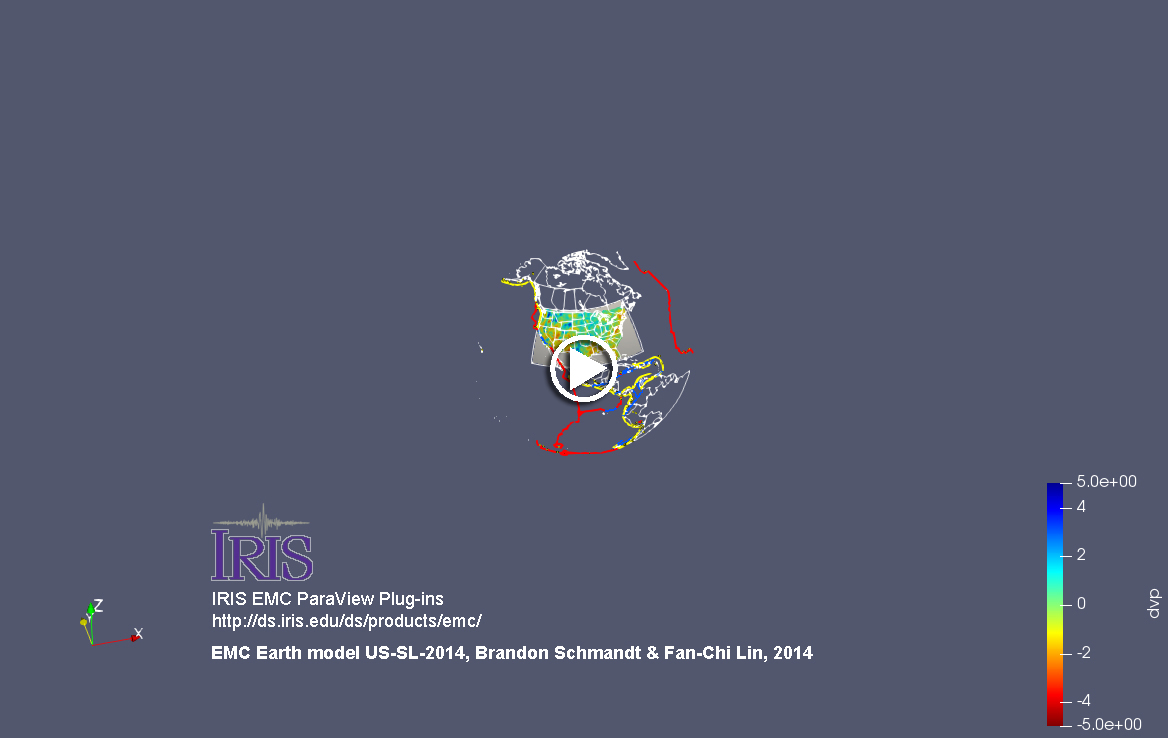
US-SL-2014 by Schmandt & Lin (2014). US-SL-2014 is a P and S teleseismic body-wave
tomography of the mantle beneath the United States. Animation displays coastline data,
plate boundaries, earthquake locations and horizontal and vertical slices of this model
(click on the image to play the video).
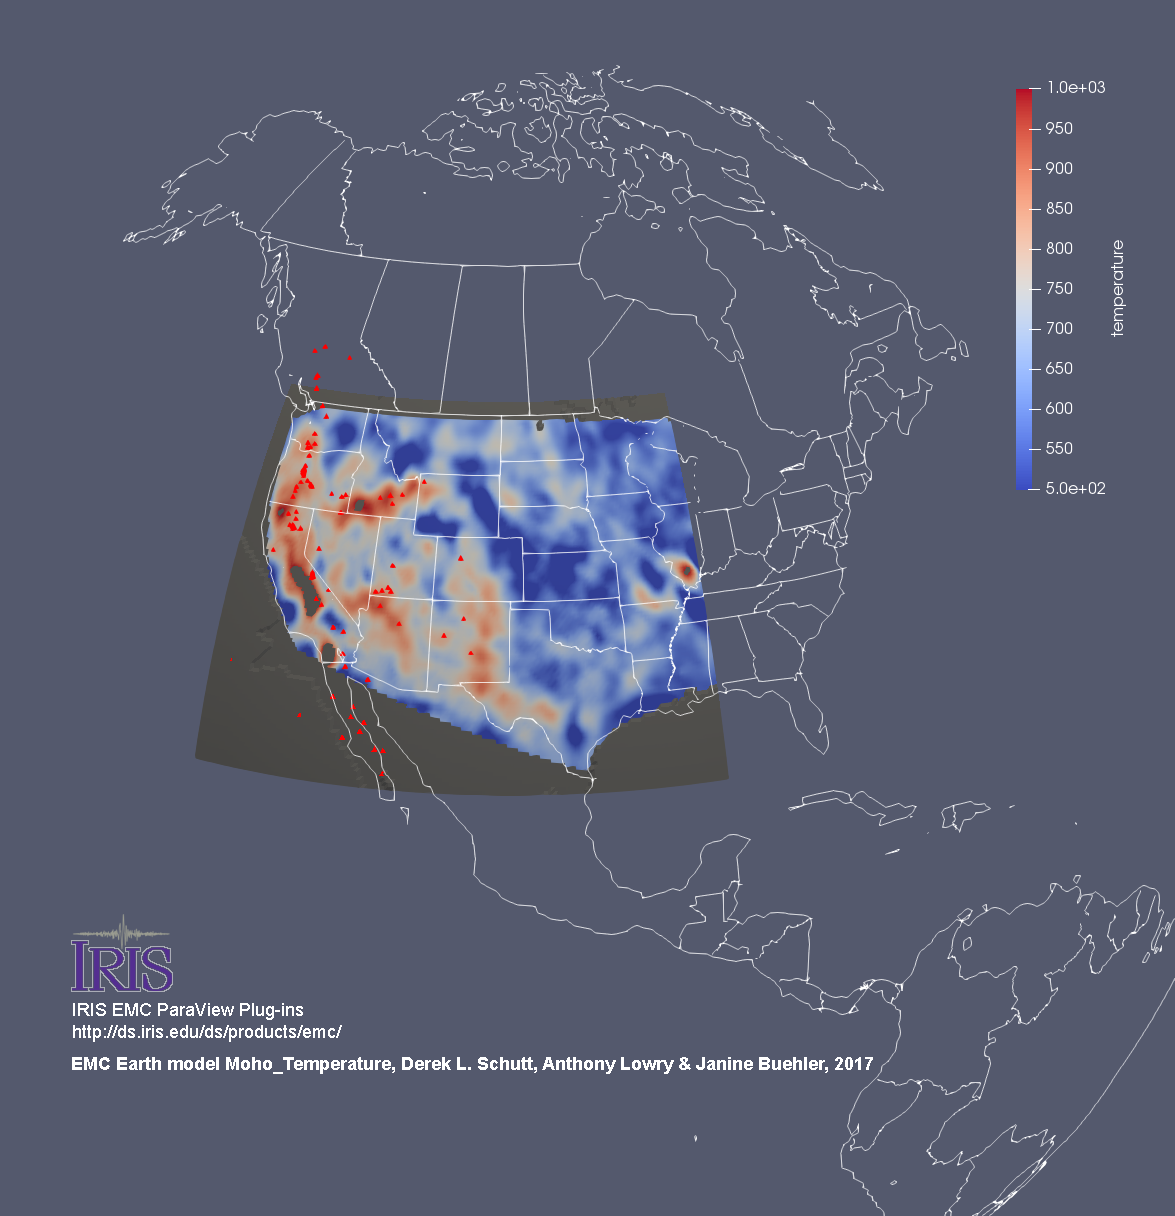
locations from WOVOdat.
The UNAVCO Integrated Data Viewer (IDV)
The UNAVCO IDV is a free Java-based desktop application that allows 3-D visualization of complex solid earth data. EMC’s netCDF Earth model data files are IDV compatible and IDV could be used to make complex visualization of EMC’s Earth models, including:
NOTE: UNAVCO is no longer supporting the IDV package
Man computer Interactive Data Access System (McIDAS-V)
McIDAS-V is a free Java-based desktop application built on VisAD and Unidata’s IDV and incorporates the functionality of McIDAS-X and HYDRA for viewing data, developing algorithms, and validating results
To view the EMC models in McIDAS-V:
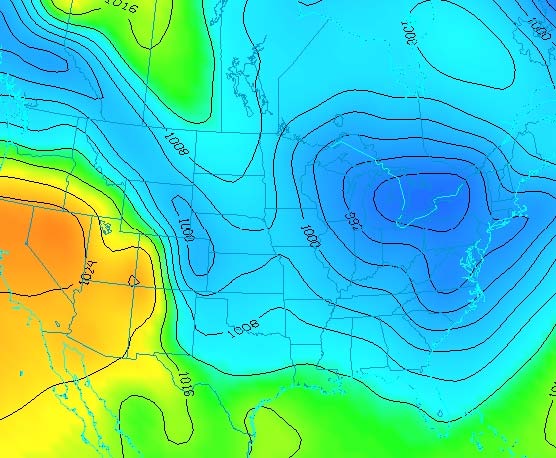
2. download the desired EMC Earth model(s) in netCDF format
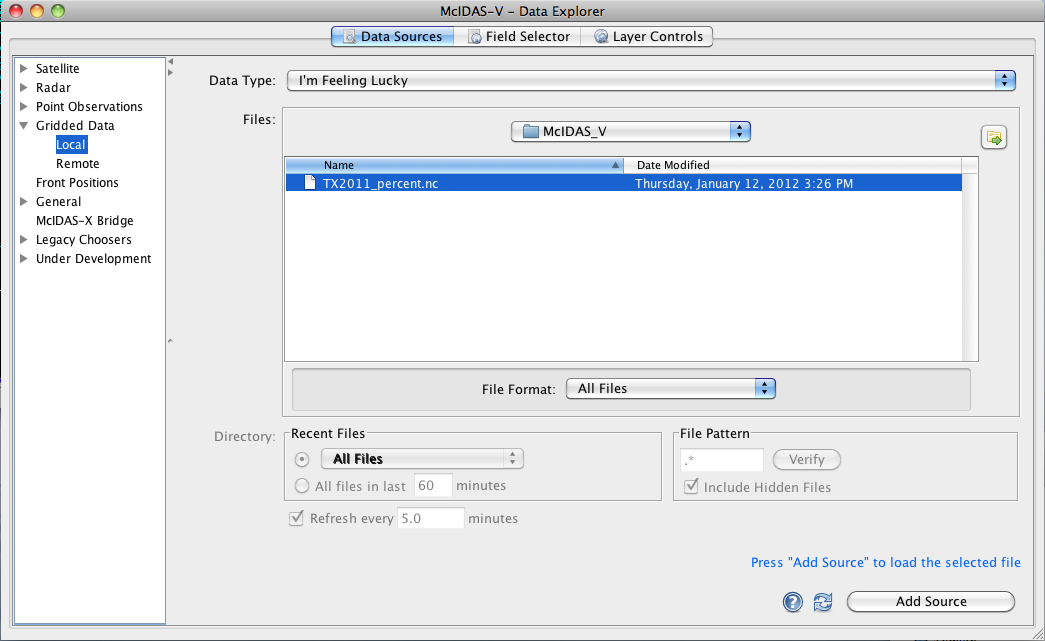
4. browse and select the desired netCDF Earth model
5. click on Add Source to load the selected file
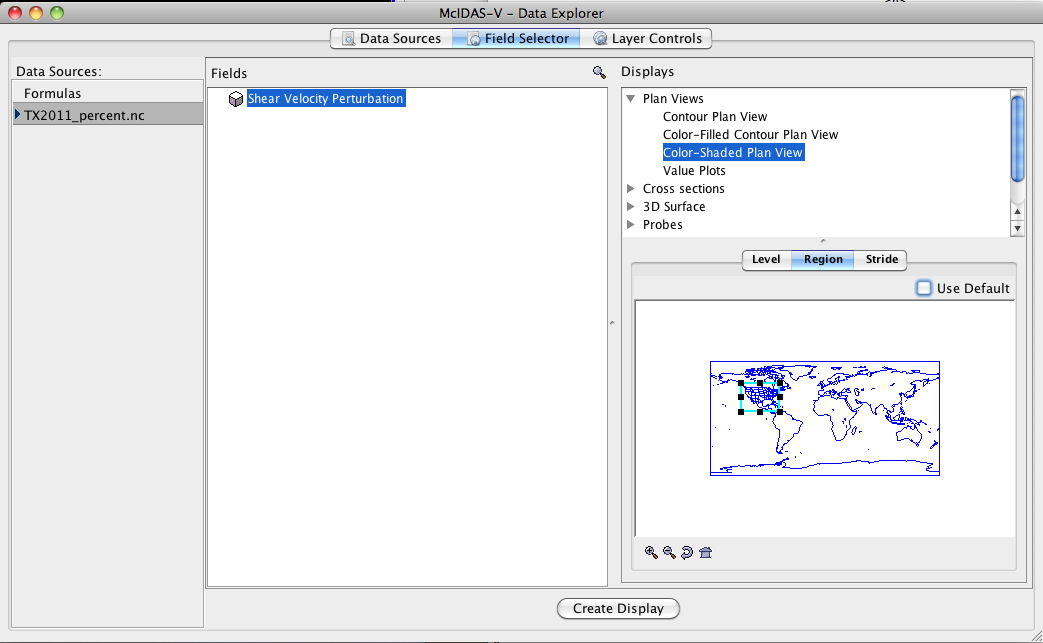
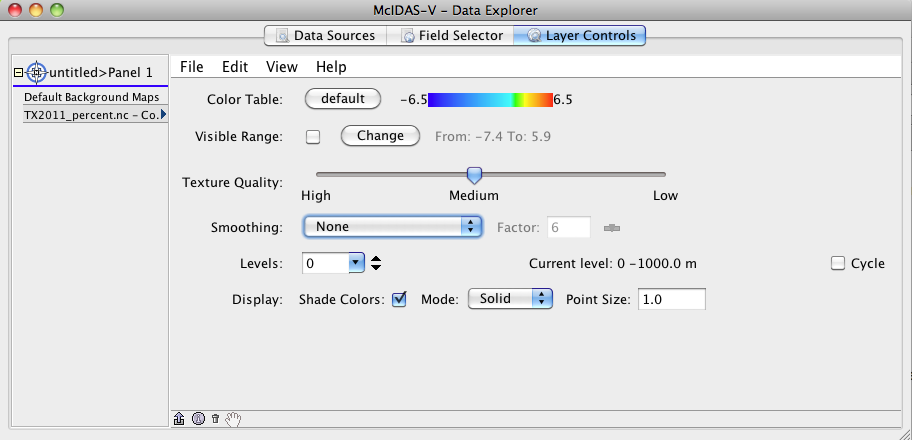
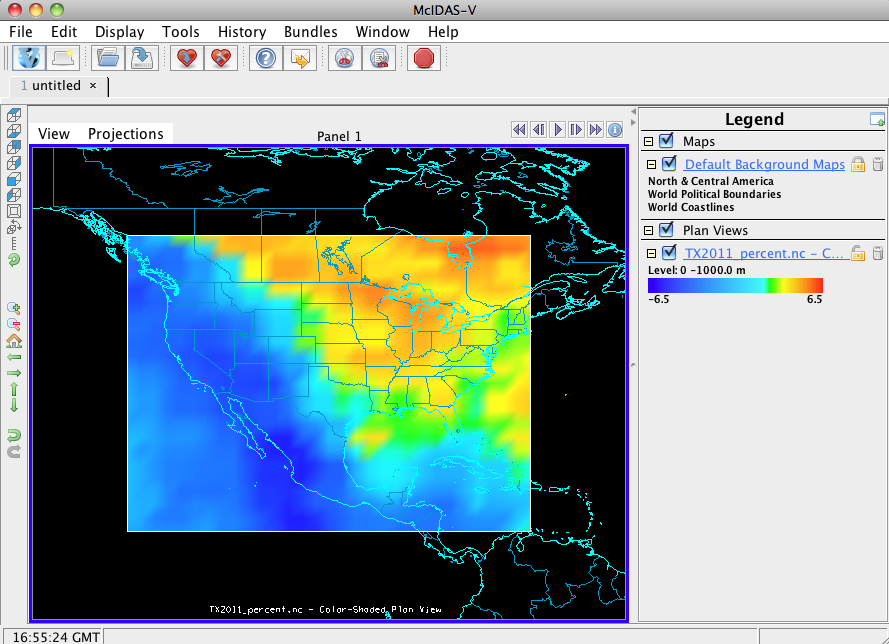
Citations and DOIs
To cite IRIS DMC Data Products effort:
- Trabant, C., A. R. Hutko, M. Bahavar, R. Karstens, T. Ahern, and R. Aster (2012), Data Products at the IRIS DMC: Stepping Stones for Research and Other Applications, Seismological Research Letters, 83(5), 846–854, https://doi.org/10.1785/0220120032.
To cite IRIS Earth Model Collaboration (EMC) data product or reference use of its repository:
- IRIS DMC (2011), Data Services Products: EMC, A repository of Earth models, https://doi.org/10.17611/DP/EMC.1.
To cite the source or reference the use of a particular Earth model hosted by EMC:
- Please visit the specific Earth model’s page of interest and click on the Citations under Quicklinks.
References
- Bedle, H., and S. van der Lee. 2009. “S velocity variations beneath North America.” J. Geophys. Res. 114:B07308.
- Burdick, S., R. D. van der Hilst, F. L. Vernon, V. Martynov, T. Cox, J. Eakins, G. Karasu, J. Tytell, L. Astiz, and G. L. Pavlis. 2010. “Model update January 2010; upper mantle heterogeneity beneath North America from P-wave travel time tomography with global and USArray transportable array data.” Seism. Res. Lett., 81(5), pp. 689-693. doi https://doi.org/10.1785/gssrl.81.5.689.
- Obrebski, M., R.M. Allen, F. Pollitz, and S.-H. Hung. 2011. “Lithosphere-asthenosphere interaction beneath the western United States from the joint inversion of body-wave traveltimes and surface-wave phase velocities.” Geophys. J. Int. 185:1003-1021.
- Pavlis, G.L , K. Sigloch, S. Burdick, M.J. Fouch, and F. Vernon. 2012. “Unraveling the geometry of the Farallon Plate: Synthesis of three-dimensional imaging results from the USArray.” in press, Tectonophysics, 2012.
- Schmandt, B. and E. Humphreys. 2010a. “Complex subduction and small-scale convection revealed by body-wave tomography of the western United States mantle.” Earth and Planetary Science Letters, 297, 435-445, https://doi.org/10.1016/j.epsl.2010.06.047.
- Sigloch, K. 2011. “Mantle provinces under North America from multifrequency P wave tomography.” Geochemistry, Geophysics, Geosystems, 18(2), Q02W08, https://doi.org/10.1029/2010GC003421.


