Summary
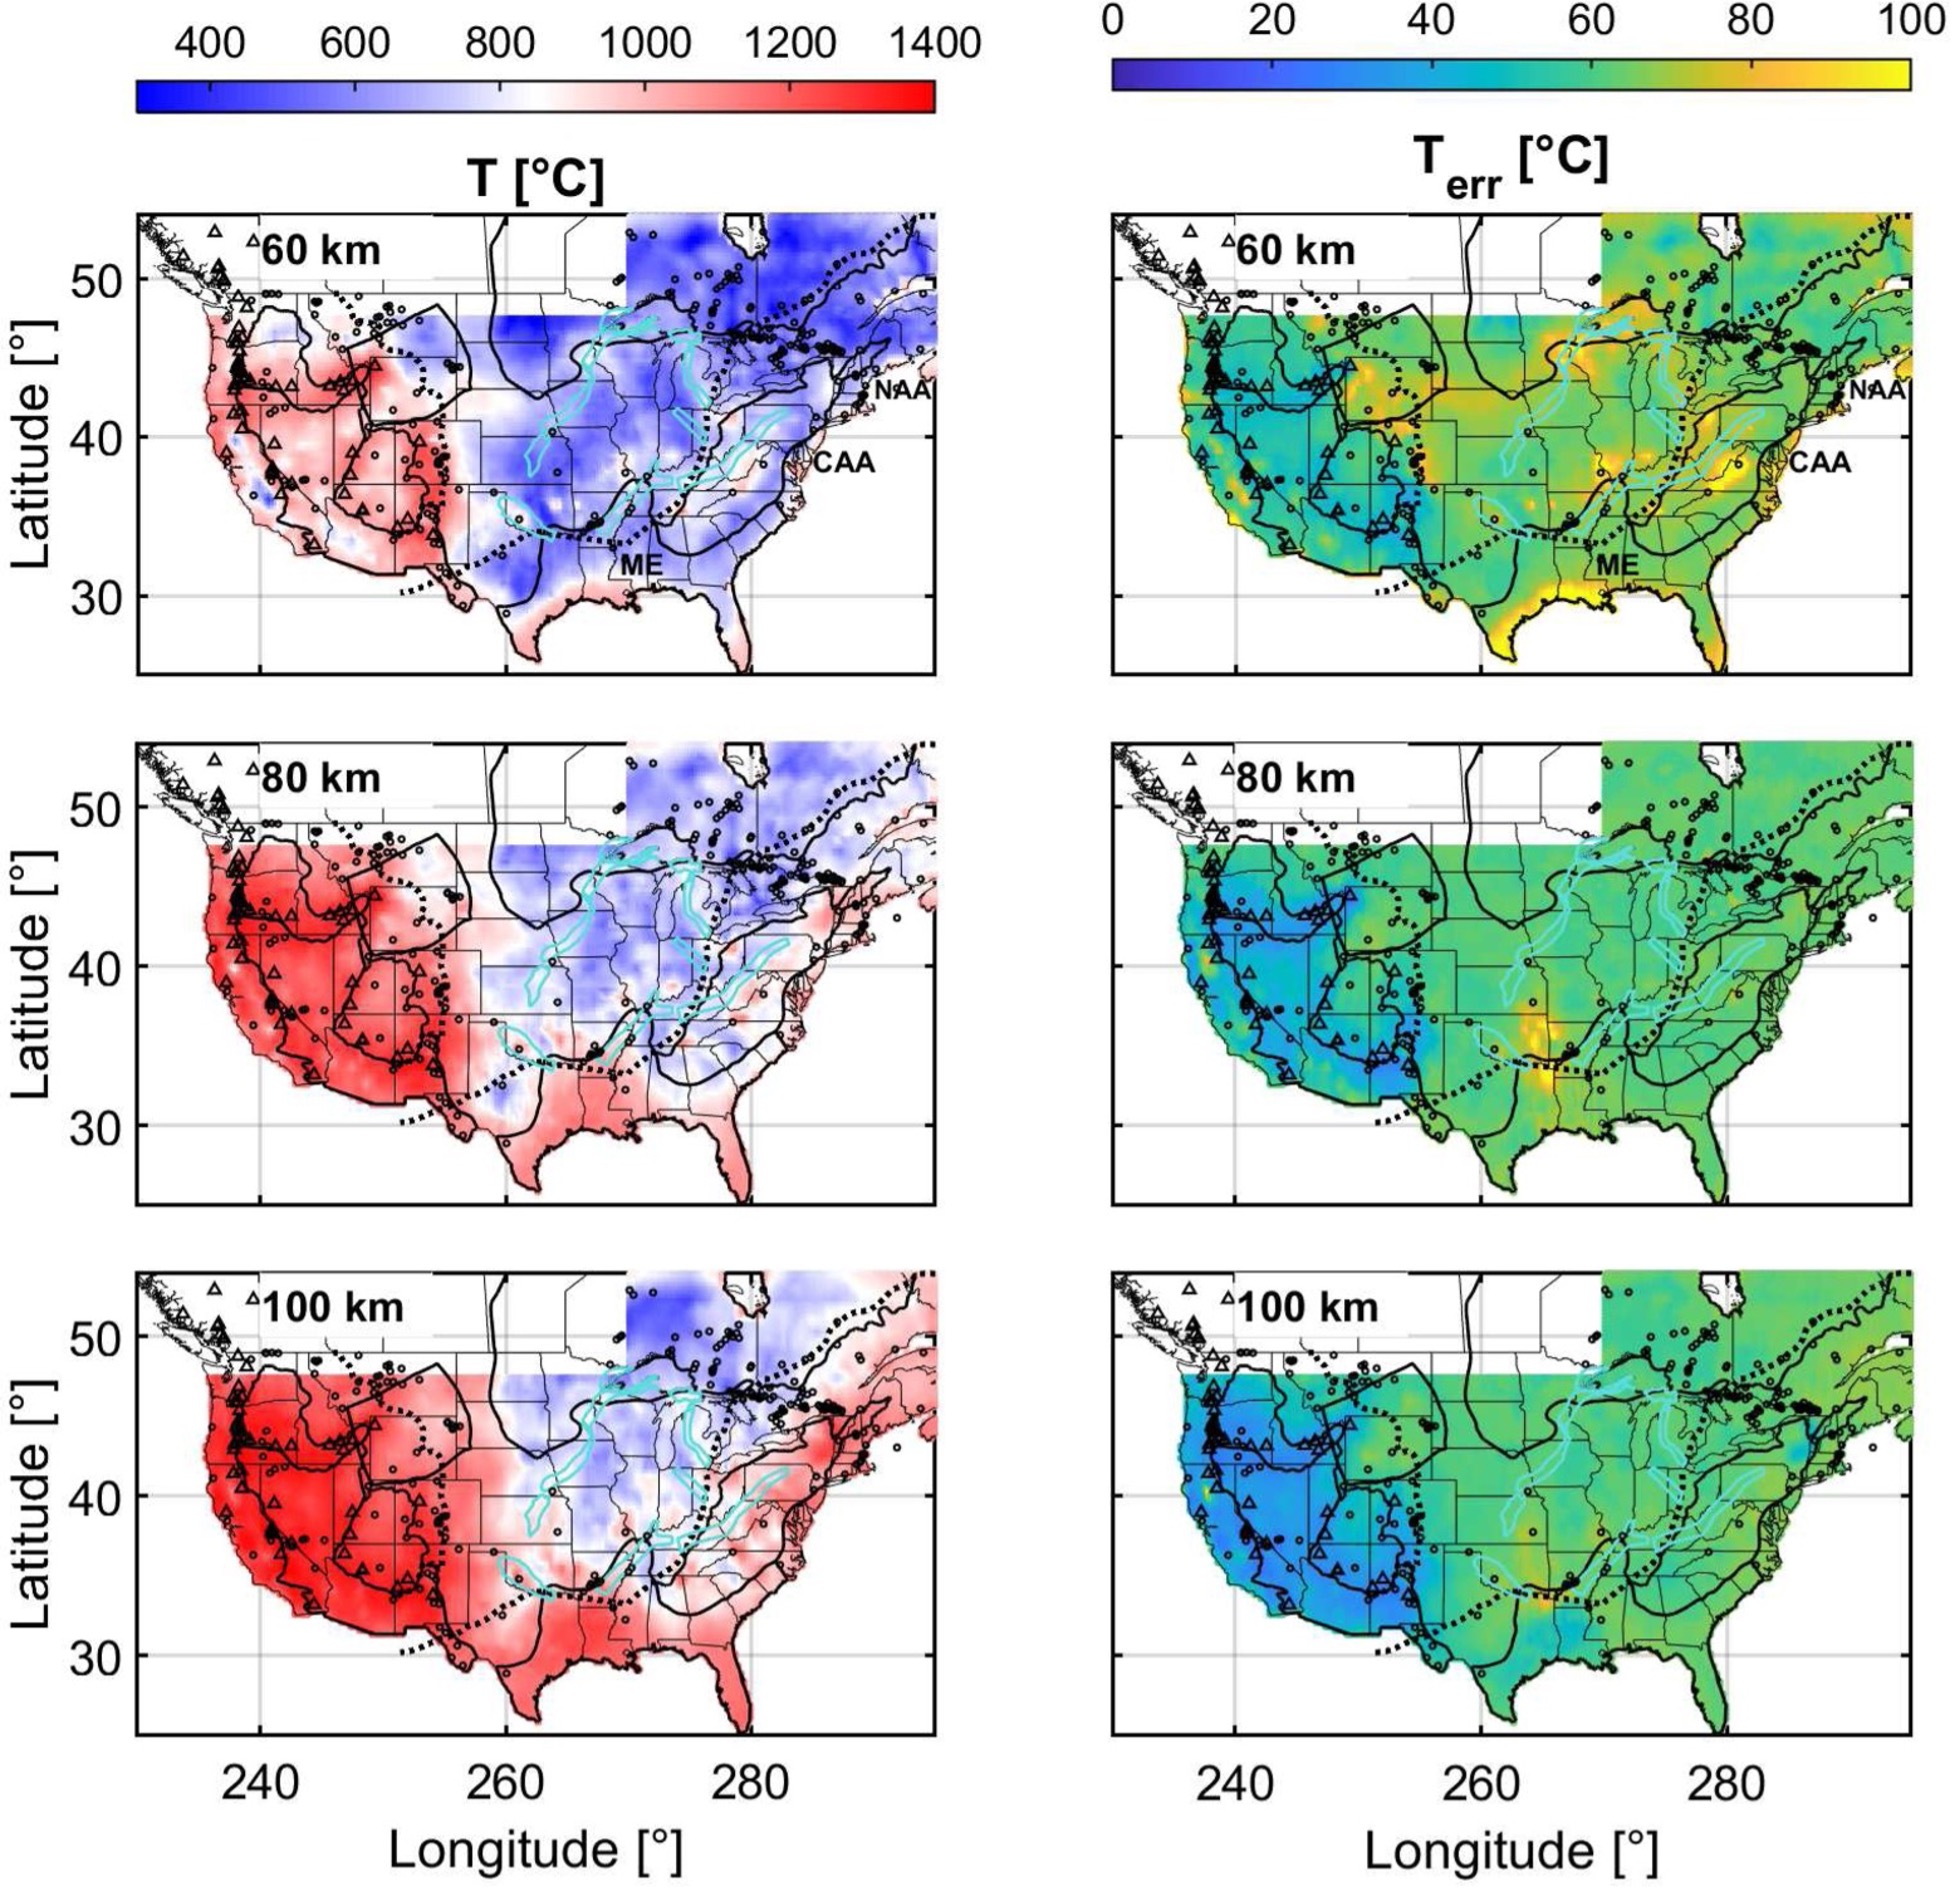
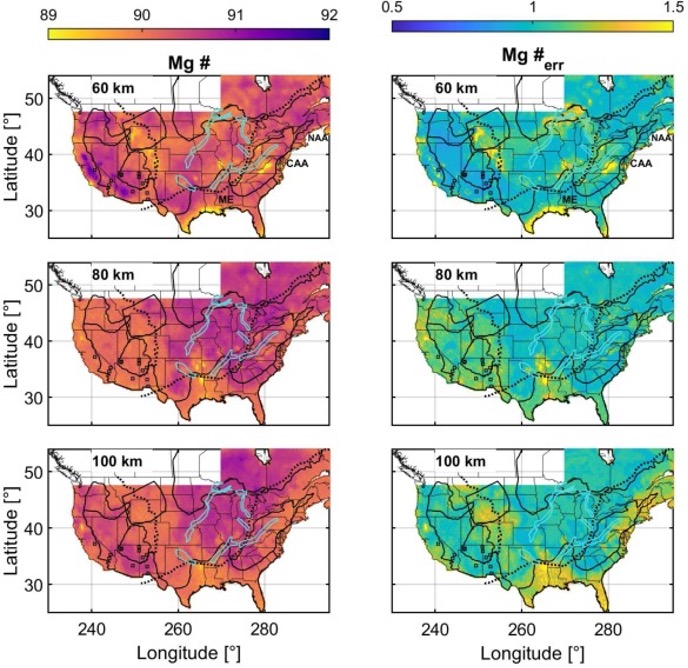
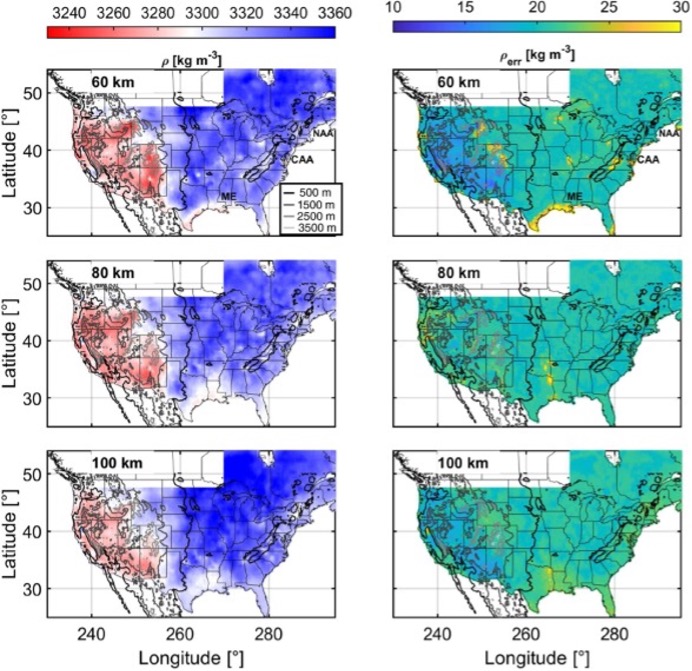
mantle_T_shinevar estimates mantle temperature, density, magnesium number, and relevant uncertainties for the shallow mantle (60-100 km) beneath the continental United States.
Quicklinks
Description
| Name | mantle_T_shinevar |
| Title | Mantle temperature, density, magnesium number, and relevant uncertainties for the shallow mantle (60-100 km) beneath the continental United States |
| Type | Temperature |
| Sub Type | Temperature (°C) |
| Year | 2023 |
| Data Revision | r0.0 (revision history) |
| Short Description | The model provides latitude, longitude, depth, Vs, Vp/Vs, temperature (°C), temperature uncertainty (°C), density (kg/m^3), density uncertainty, magnesium number, magnesium number uncertainty, compositional buoyancy, and buoyancy number for the shallow mantle beneath the continental United States. |
| Authors: | William J. Shinevar, Department of Geological Sciences, University of Colorado, Boulder, Boulder, Colorado 80309 USA Eva M. Golos, Department of Geoscience, University of Wisconsin – Madison, Madison, Wisconsin 53706 USA Oliver Jagoutz, Department of Earth, Atmospheric, and Planetary Sciences, Massachusetts Institute of Technology, Cambridge, Massachusetts 02139 USA Mark D. Behn, Department of Earth and Environmental Sciences, Boston College, Chestnut Hill, Massachusetts 02467 USA Robert D. van der Hilst, Department of Earth, Atmospheric, and Planetary Sciences, Massachusetts Institute of Technology, Cambridge, Massachusetts 02139 USA |
| Reference Model | NA |
| Previous Model | NA |
| Model Download | mantle-T-shinevar.r0.0.nc (see metadata) in netCDF 3 Classic format. |
| Depth Coverage | 60-100 km |
| Area | continental United States (latitude: 25°/55°; longitude: 235°/ 297°) |
| Data Set Description | Here we present the predicted mantle temperature, density, magnesium number, compositional buoyancy, and buoyancy number at 60, 80, and 100 km depth from (Shinevar et al., 2023) along with the associated uncertainties. The data sets and uncertainties are calculated applying the WISTFUL (Shinevar et al., 2022) on collocated Vs and Vp/Vs from MITPS_20 at 60–100 km depth (Golos et al., 2020). For these calculations, we utilize the mantle attenuation model of Behn et al. (2009) assuming a grain size of 1 cm and olivine water content of 50 H/106 Si in line with mantle xenoliths from the western US. Attenuation corrections are calculated at the dominant frequencies for each depth. For more detailed methods, see section 3 (Methodology) of Shinevar et al. (2023) and Golos et al. (2020) for details on the seismic tomography. Our results generally agree within error with recent (<10 Ma) xenolith compositions and with results from xenolith thermobarometry. |


Citations and DOIs
To cite the original work behind this Earth model:
- Shinevar, W.J., Golos, E.M., Jagoutz, O., Behn, M.D., van der Hilst, R.D., 2023. Mantle Thermochemical Variations beneath the Continental United States Through Petrologic Interpretation of Seismic Tomography. Earth Planet. Sci. Lett. https://doi.org/10.1016/j.epsl.2022.117965
To cite IRIS DMC Data Products effort:
- Trabant, C., A. R. Hutko, M. Bahavar, R. Karstens, T. Ahern, and R. Aster (2012), Data Products at the IRIS DMC: Stepping Stones for Research and Other Applications, Seismological Research Letters, 83(5), 846–854, https://doi.org/10.1785/0220120032.
DOI for this EMC webpage: https://doi.org/10.17611/dp/emc.2023.mantletshinevar.1
References
- Behn, M.D., Hirth, G., Elsenbeck, J.R., 2009. Implications of grain size evolution on the seismic structure of the oceanic upper mantle. Earth Planet. Sci. Lett. 282, 178–189. https://doi.org/10.1016/j.epsl.2009.03.014
- Golos, E.M., Fang, H., van der Hilst, R.D., 2020. Variations in Seismic Wave Speed and VP/VS Ratio in the North American Lithosphere. J. Geophys. Res. Solid Earth 125. https://doi.org/10.1029/2020JB020574
- Shinevar, W.J., Jagoutz, O., Behn, M.D., 2022. WISTFUL: Whole-Rock Interpretative Seismic Toolbox for Ultramafic Lithologies. Geochemistry Geophys. Geosystems 23. https://doi.org/10.1029/2022GC010329
Credits
- r0.0 model provided by William J. Shinevar.
Revision History
revision r0.0: uploaded March 08, 2023.
Timeline
- 2023-03-08
- online


