Summary
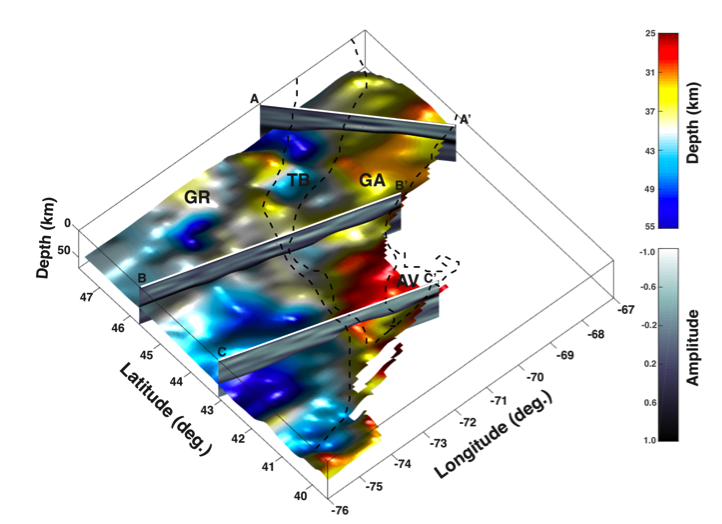
The Moho depths beneath the northern Appalachian Mountains were extracted from 5875 teleseismic P wave receiver functions using the common conversion point (CCP) stacking method.
Quicklinks
Description
| Name | NorthernAppalachians_Moho2018 | |
| Title | Crustal Thickness Variation in the Northern Appalachian Mountains: Implications for the Geometry of 3-D Tectonic Boundaries Within the Crust | |
| Type | Crustal thicknesses | |
| Sub Type | Depth km | |
| Year | 2018 | |
| Short Description | The Moho depths beneath the northern Appalachian Mountains were extracted from 5875 teleseismic P wave receiver functions using the common conversion point (CCP) stacking method. |
|
| Author: | ||
| Cong Li | ||
| Department of Geosciences, University of Massachusetts | ||
| 233 Morrill Science Center | ||
| 627 North Pleasant Street. Amherst, MA 01003, USA | ||
| E-mail: conli@geo.umass.edu | ||
| Previous Model | N/A | |
| Reference Model | N/A | |
| Model Download | The above model expressed as depth in km with 0.1° grid resolution: NorthAppalachian-Moho-2018-0.1.nc (see metadata ), is the netCDF file for the model The above model expressed as depth in km with 0.5° grid resolution: NorthAppalachian-Moho-2018-0.5.nc (see metadata ), is the netCDF file for the model |
|
| Original Model Repository | https://agupubs.onlinelibrary.wiley.com/doi/pdf/10.1029/2018GL078777 |
|
| Depth Coverage | ||
| Area | northeastern North America (latitude: 39.5°/47.7°; longitude: -76.2°/-67°) | |
| Data Set Description | This model includes Moho depth in two scales: 1) Moho depth values extracted from the common conversion point (CCP) stacking of teleseismic P wave receiver functions every 0.5 degree. 2) Interpolated Moho depth with the interval of 0.1 degree using triangulation-based cubic interpolation method. We obtained receiver functions from 688 high-quality earthquake events recorded by a total of 87 permanent and 109 temporary broadband seismic stations in this region (see Li et al., 2018 for details). Images of the extracted Moho are available in Li et al. (2018) | |
| Supplemental Information | ||

Citations and DOIs
To cite the original work behind this Earth model:
- Li, C., Gao, H., Williams, M. L., & Levin, V. (2018). Crustal thickness variation in the northern Appalachian Mountains: Implications for the geometry of 3-D tectonic boundaries within the crust. Geophysical Research Letters, 45. https://doi.org/10.1029/2018GL078777
To cite IRIS DMC Data Products effort:
- Trabant, C., A. R. Hutko, M. Bahavar, R. Karstens, T. Ahern, and R. Aster (2012), Data Products at the IRIS DMC: Stepping Stones for Research and Other Applications, Seismological Research Letters, 83(5), 846–854, https://doi.org/10.1785/0220120032.
DOI for this EMC webpage:
Credits
Model contributed by Cong Li
Timeline
- 2018-07-23
- online


