Summary
A collection of continuous envelope functions to search for tectonic tremor and for data quality analysis. Envelope functions are computed automatically by the Earth and Space Sciences Department of the University of Washington utilizing selected portions of the IRIS DMC waveform archive and are distributed by the IRIS DMC.
Quicklinks
Description
A collection of continuous envelope functions to search for tectonic tremor and for data quality analysis. Envelope functions are computed automatically by the Earth and Space Sciences Department of the University of Washington utilizing selected portions of the IRIS DMC waveform archive and are distributed via IRIS's Searchable Product Depository (SPUD).
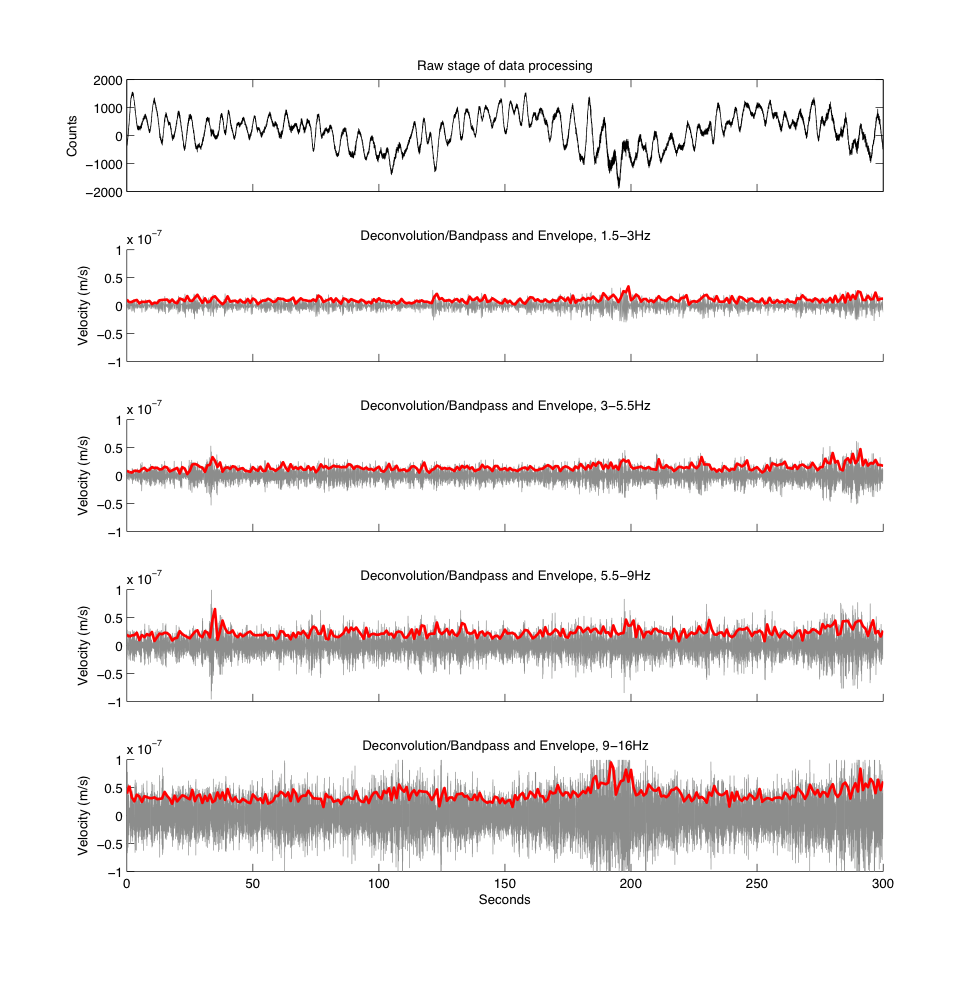
Continuous envelope functions are calculated at four different pass-bands (1.5-3.0Hz, 3.0-5.5Hz, 5.5-9.0Hz, and 9.0-16.0Hz) for each station-channel in a given network-year. Only channels with high gain and high sample rate are used. Envelope functions from different pass-bands are calculated so that they can be combined (square root of sum of squares) to create wider bands.
Applications
- Tremor Detection and Location. These envelope functions can be used to search for and locate tectonic tremor. There are a variety of specific methods to accomplish this, from cross-correlation of envelopes to find periods of coherent signal across multiple stations in a region (Obara, 2002; Wech and Creager, 2008; Maeda and Obara, 2009; Ide, 2010), to examination of single-station envelopes (Brudzinski and Allen, 2007) or envelope stacks (Aguiar et al, 2009). Since the instrument response has also been removed, the envelope functions can be used to obtain an accurate tremor amplitude catalog (Maeda and Obara, 2009).
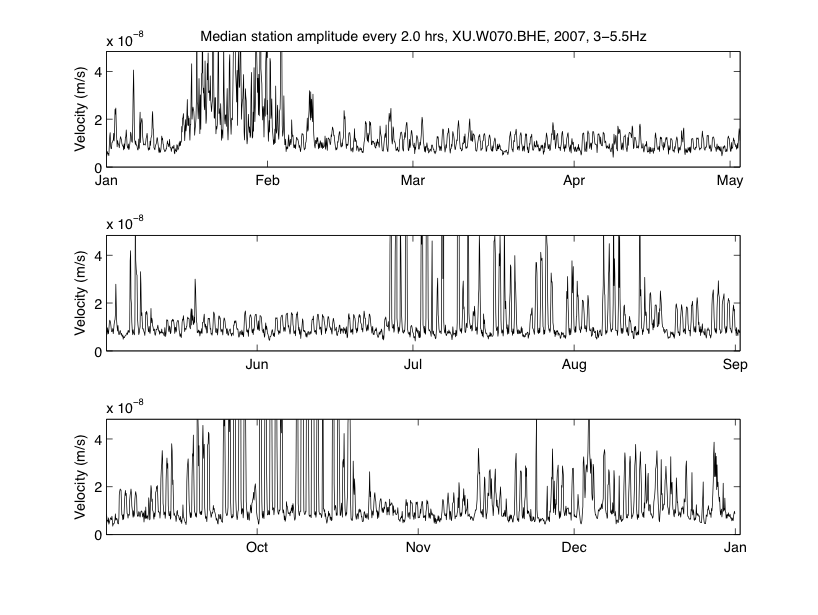
- Quality Control. Daily or hourly averages of these envelopes can be examined for a particular station or across a network to efficiently identify state of health issues and monitor day/night/weekend/seasonal variations in noise levels.

Envelope Algorithm
The algorithm to calculate envelope functions is as follows:
- Read raw data for network-station-channel-location-day, with 2 minutes added at each end to avoid artifacts from filtering
- Demean
- Hanning taper 30s on each edge
- Resample data to improve computational efficiency
- Deconvolve pole-zero part of instrument response to get ground velocity and apply zero-phase band-pass filters (1.5-3.0Hz, 3.0-5.5Hz, 5.5-9.0Hz, and 9.0-16.0Hz)
- Calculate envelope functions (square root of the square of the seismogram plus the square of its Hilbert transform)
- Apply anti-aliasing filters and resample in steps to 1s interval
- Save as SAC files for each pass band and time segment, cut at day boundaries

Data Availability, Access & Organization
The envelope functions for the following networks are computed:
| Network | Year | Partial/Complete | Files | Size |
|---|---|---|---|---|
| 7D, Cascadia Initiative Community Experiment-OBS component | 2011, 2012, 2014 & 2015 | P (through September 2015) | > 863,000 | ~253 GB |
| AV, Alaska Volcano Observatory | 2012 | C | > 4,492,600 | ~79GB |
| UW, Pacific Northwest Regional Seismic Network | 2003-2005 | P (no eastern stations) | > 2,862,290 | ~178 GB |
| XE, Broadband Experiment Across Alaskan Range | 1999, 2000 & 2001 | C | > 119,000 | ~30 GB |
| XQ, Chile RAMP | 2007-2009 | C | > 486,000 | ~154 GB |
| XY, Chile RAMP | 2010 | C | > 122,000 | ~35 GB |
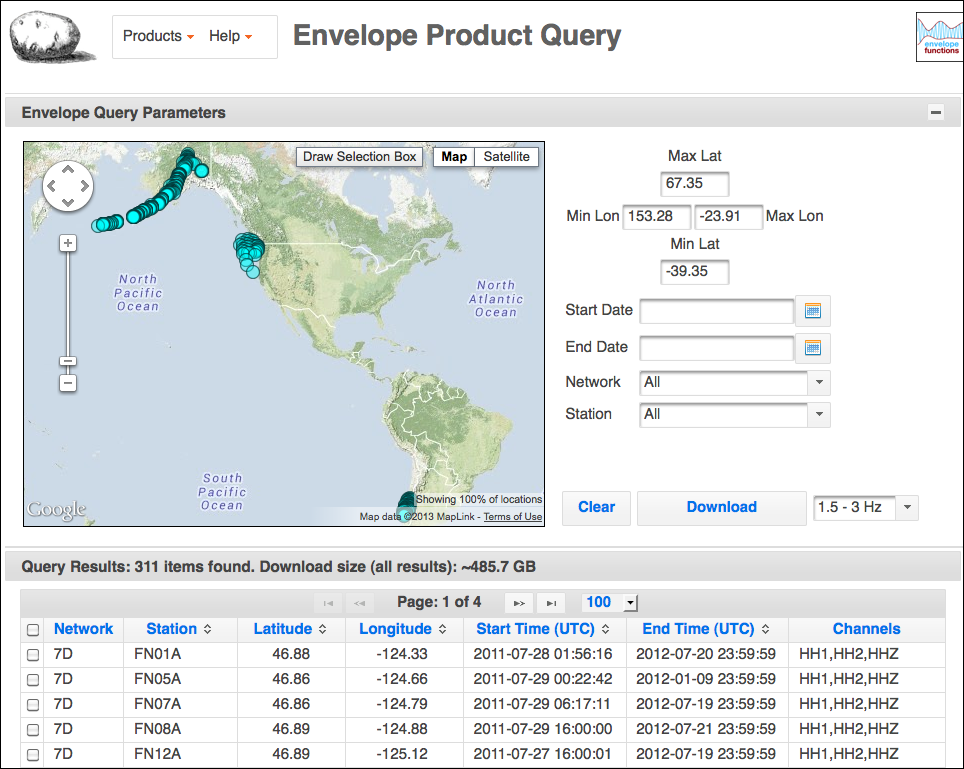
The envelope functions are available for download by querying the IRIS's Searchable Product Depository (SPUD). The Envelope Product Query page provides the following capabilities for downloading the envelope functions:
- Each row displays the availability information for a given network-station pair.
- Column headings control sort order of results.
- Use map to constrain latitude and longitude.
- Max and min latitude and longitude can be entered in the corresponding text fields.
- Start and end dates can be used to limit the download to a specific time window.
- Network and Station drop downs can be used to select specific network and/or stations.
- Clear button removes all selection criteria
- Download button will return a zip file containing all items matching current criteria or only selected items (if any are selected via leftmost column)
The envelope function files in the download bundle are organized in directories by Network_Station. Each directory contains (# passbands X # time segments) files.
Files are named according to: YEAR_JDAY_HHMMSS_NET_STA_LOC_CHAN_freqband_ENV.SAC (e.g. 2003_001_012400_UW_GNW_—_BHZ_3-5.5Hz_ENV.SAC), where JDAY is the Julian day of the year and HHMMSS is the starting time for the data segment.
Citations and DOIs
To cite the IRIS DMC Data Products effort:
- Hutko, A. R., M. Bahavar, C. Trabant, R. T. Weekly, M. Van Fossen, T. Ahern (2017), Data Products at the IRIS‐DMC: Growth and Usage, Seismological Research Letters, 88, no. 3, https://doi.org/10.1785/0220160190.
To cite the IRIS DMC Envelope Functions data product or reference the use of its repository:
- IRIS DMC (2014), Data Services Products: EnvelopeFunctions Continuous envelope functions, https://doi.org/10.17611/DP/EF.1.
To cite the source of Envelope Functions:
- Ken Creager & Carl Ulberg, Earth and Space Sciences, University of Washington (2014), Data Services Products: EnvelopeFunctions Continuous envelope functions, doi:.
References
- Aguiar, A. C., T. I. Melbourne, and C. W. Scrivner (2009), Moment release rate of Cascadia tremor constrained by GPS, Journal of Geophysical Research-Solid Earth, 114, B00A05, https://doi.org/10.1029/2008JB005909.
- Brudzinski, M. R. and R. M. Allen (2007), Segmentation in episodic tremor and slip all along Cascadia RID A-8301-2011, Geology, 35(10), 907-910, https://doi.org/10.1130/G23740A.1.
- Ide, S. (2010), Striations, duration, migration and tidal response in deep tremor, Nature, 466(7304), 356-U105, https://doi.org/10.1038/nature09251.
- Maeda, T. and K. Obara (2009), Spatiotemporal distribution of seismic energy radiation from low-frequency tremor in western Shikoku, Japan, Journal of Geophysical Research-Solid Earth, 114, B00A09, https://doi.org/10.1029/2008JB006043.
- Obara, K. (2002), Nonvolcanic deep tremor associated with subduction in southwest Japan, Science, 296(5573), 1679-1681, https://doi.org/10.1126/science.1070378.
- Wech, A. G. and K. C. Creager (2008), Automated detection and location of Cascadia tremor, Geophys. Res. Lett., 35(20), L20302, https://doi.org/10.1029/2008GL035458.
Credits
- Ken Creager, University of Washington
- Carl Ulberg, University of Washington
- Manochehr Bahavar, IRIS DMC
Timeline
- 2014-04-28
- Initial release


