


Summary
UNRELEASED PRODUCT — INACTIVE
Status: Inactive
Last update: 2015-10-28
Travel time residuals for major phases using 1D ray-paths through global 3D models available from the IRIS DMC Earth Model Collaboration (EMC) repository.
Quicklinks
Description

Calculation of travel-times through 3D models requires resource intensive 3D ray tracing techniques. 3D travel times are approximated to first-order here by summing travel time residuals along 1D ray paths (calculated with TauP Toolkit) through different global 3D mantle velocity models in the EMC. These are calculated for all earthquakes after 1988 with magnitudes > 7.0 to all operating GSN and FDSN broadband stations. The results are available here as travel time residuals, the difference between the 1D and approximated 3D travel times.
For our test example, we have selected the iasp91 (Kennett and Engdahl, 1991) model to compute the ray paths and travel times between the 2011 Tohoku earthquake location and the GSN and FDSN network station.
The results are outputted as a text file with one station per row and the travel-time residuals for various models recorded in individual columns as shown in Table 1 (full output).
Table 1. Sample output of the travel-time resiudual computation
net            	sta       	lat       	lon       	phase  GyPSuM	S362ANI	S362AN+M S362WMANI	SAW642AN
----           	-----     	-----     	------    	------ ------   ------   ------   ------   	------
AU             	STKA           -31.88	         141.60 	S      -3.01   -10.09   -9.85     -10.36	 -3.83
BK             	CMB       	38.03   	-120.39 	S	7.43	 2.83	 2.84	    2.48	  6.23
BK             	HUMO      	42.61		-122.96 	S	8.16	 3.55	 3.58	    3.53	  6.43
BK             	MCCM      	38.14   	-122.88 	S	8.05	 2.96	 3.06	    2.93	  6.92
BK             	SAO       	36.76   	-121.45 	S	7.36	 2.74	 2.81	    2.55          6.35
BK             	WDC       	40.58   	-122.54 	S	8.03	 3.24	 3.29	    3.17	  6.74
For visual comparison of travel-time residuals computed for different models, Figures 2 & 3show the computed travel-time residuals for the S362ANI+M and SEMum respectively using a color scale.
Example model S362ANI+M travel-time residuals:
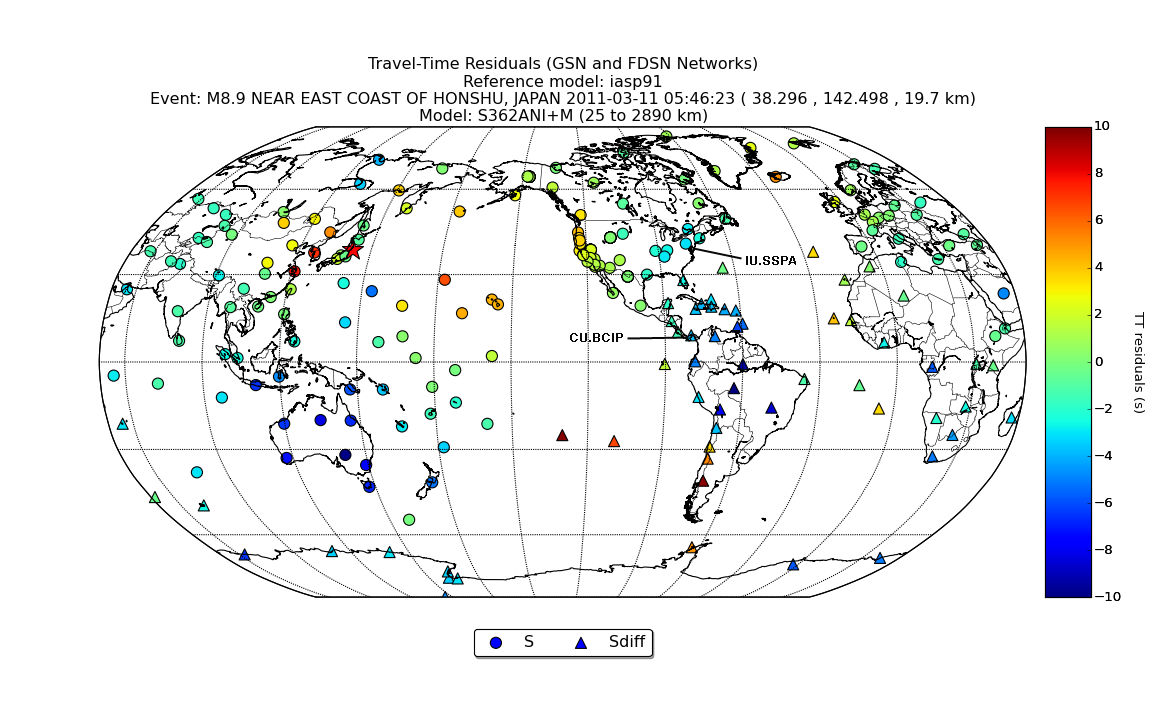
Figure 2. Example of estimated travel-time residuals for the 2011 Tohoku earthquake at \nFDSN and GSN stations derived from the S362ANI+M model using iasp91 ray-paths.
Example model SEMum travel-time residuals:

Citations and DOIs
PLEASE DO NOT QUOTE OR CITE THIS PAGE. THIS IS A WORK IN PROGRESS.
References
- Kennett, B. L. N. and E. R. Engdahl (1991). Traveltimes for global earthquake location and phase identification, Geophysical Journal International 105, 429–465.
Credits
- DMC Data Products Team


