 The Interactive Earthquake Browser
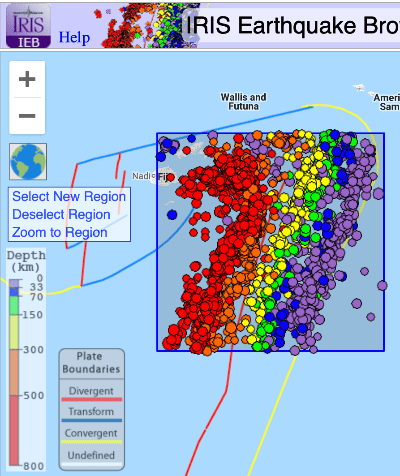
The Interactive Earthquake Browser (IEB) is an interactive map for displaying selections of up to 25,000 seismic event epicenters (normally earthquakes) on a map of the world. There are millions of events to choose from.
These event selections can also be viewed in profile and freely rotated with the 3D Viewer tool. They can also be viewed as sortable tables, exported to spreadsheet format and animated over time on the map.
A notable feature of the map is it can be bookmarked with (almost) all of its settings preserved in the bookmark, and thus can be emailed, socially shared, or just referred to later. Other websites can dynamically construct IEB URLs and thereby send people to a certain very specific place, time, and set of earthquakes. Here is an example.
IEB is intended to be easy-to-use and provide value as an educational tool and for some scientific research-related purposes.
Note: The terms "earthquakes", "quakes" and "events" may be used interchangeably in this document. The reason the word "events" is used is that human activities (bombs, demolitions, mining, etc), as well as phenomena like meteors, may also be detected, and there is no difference to a seismometer whether the cause was actually an earthquake or not.
IEB is a Google map. By default, it uses earthquake data obtained about every 15 minutes from the USGS. IEB has accumulated about 3 million USGS earthquakes, dating from about 1970 to about an hour ago.
About small magnitudes in the U.S.Though the default map event data are from the USGS, IEB also maintains a separate, extended database, which contains a mix of about 5.8 million earthquakes dating from same time range. See the Data Source option below.
The user selects earthquakes to display on the map using filtering options like date, magnitude and depth ranges, along with choosing a priority for either the most recent or the largest magnitude earthquakes. Regions of interest can be selected by drawing a selection box on the map.
For practical reasons, only a small subset of the millions of earthquakes can be shown at a given time (currently up to 25,000). That is why a priority of newest vs. largest is needed. However, by zooming, panning and selecting regions, the user can quickly discover all of the earthquakes in the database for any region of the world.
When zooming and panning, the earthquakes displayed update dynamically. The filter options mentioned above are re-applied and the database re-queried as soon as the mouse (or finger on a tablet) is released -- to match the currently-visible boundaries of the map. With larger numbers of events this can cause a delay which is not convenient.
So the solution is this:
If you have selected a region
of interest, then that set of earthquakes shown on the map is "locked", and
zooming or panning will NOT cause a database update or delay. To resume dynamic updating deselect the region.
Region selections can be as tiny as a few kilometers square!
Tip: If your intention is to view the whole world, do not just make a huge selection box, instead simply deselect any region you may have selected and zoom out to where the whole world is visible. The first approach is one of the slowest database queries possible, and the second is the fastest.
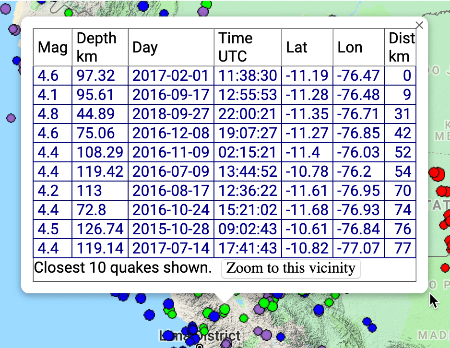
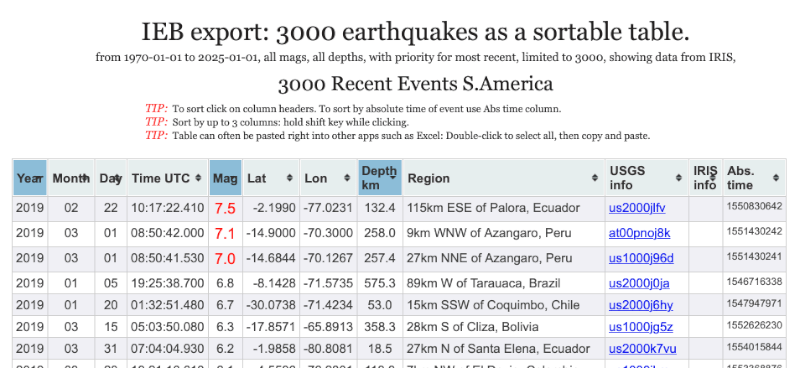
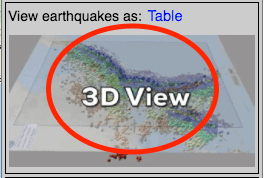
Earthquakes shown or selected on the map may be viewed in a table, rotated in 3D or downloaded using the "View earthquakes as: Table or 3D", found in the Options panel.
The resulting table can be sorted by up to three of its columns. It can be copied, by double clicking it, and pasted into various editors and programs such as Excel. Direct exporting to CVS and NetCDF formats is also possible.
Recent versions of Chrome, Safari and Firefox work best. All WebKit-based browsers tested work. Most recent tablets work, too.
Older versions of Internet Explorer do not work well with IEB, though the newer Microsoft Edge browser (mid 2019) will likely work fine.
Finally, your computer's operating system, clock speed, available memory and Internet connection bandwidth will all impact performance.
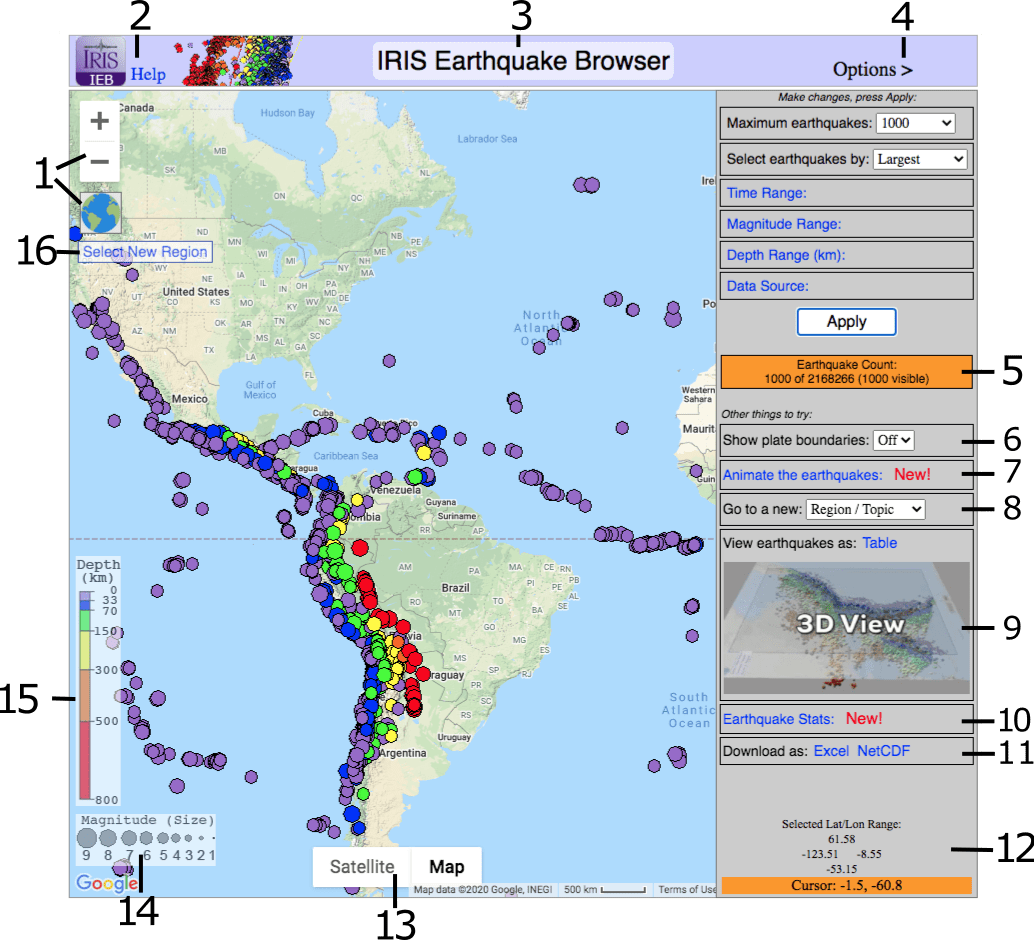
The following diagram describes some of the features available in IEB:
 icon zooms all the way out at
once.
icon zooms all the way out at
once.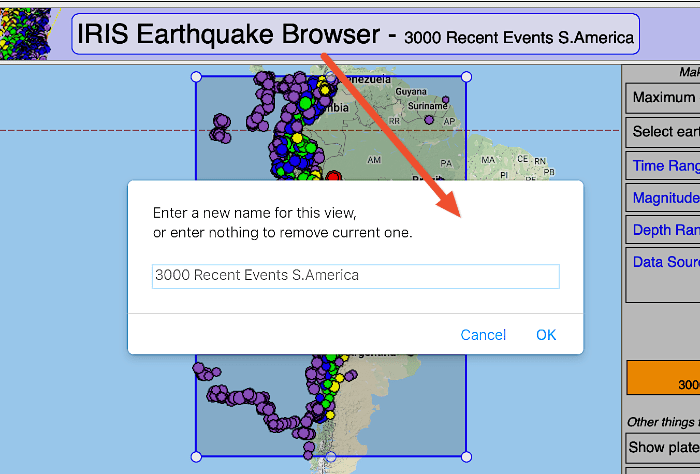
To save or share your map:
Be sure to press Apply after making changes!
Earthquake miltering determines which earthquakes from the database are shown at any given time. The events you get are filtered in two ways:
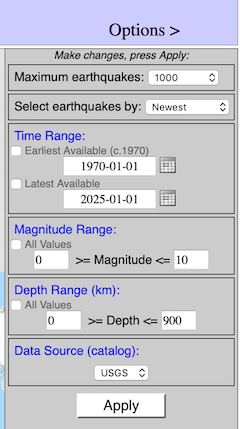
The first two options, Maximum earthquakes: and Select earthquakes by: , determine the number of earthquakes and which of the millions available will be displayed on the map. The rest of the options further restrict ranges of time, magnitude and depth to affect what is displayed. You will be prompted to press Apply when you make changes to these settings.
Options Maximum earthquakes: and Select earthquakes by: are always shown. To reveal the other options you must click on their option names ( blue").
Maximum earthquakes: determines the maximum number of quakes that will be shown in any given view. You can choose values between 10 and 25,000.
Note: displaying too many quakes can cause some web-browsers or tablets to be slow or unresponsive. Try 5,000 and 10,000 before going higher.
Time Range: determines the dates of the earthquakes that will be shown. By default, all available dates are used: Earliest Available to Latest Available.
To use your own date range, uncheck one or both of the checkboxes and enter dates in the text fields or the date picker popups. Dates are in Universal Time (UTC) and run midnight to midnight.
Magnitude Range: determines the magnitudes of the earthquakes that will be shown. By default, all available magnitudes are used.To use your own magnitude range, uncheck the checkbox and enter values in the text fields.
Depth Range: determines the depths of quakes that will be shown. By default, all available depths are used.
To use your own depth range, uncheck the checkbox and enter values in the text fields.
Data Source: IEB uses USGS data by default. If you wish to see more events, EarthScope Consortium has a much larger database, from mixed sources, mainly the USGS plus the ISC.
Data Source options:
USGS - Single source. Greater reliability of location and magnitude, but fewer small
earthquakes outside N. America
MIXED - Multiple sources including International Seismological Centre and USGS. Some
locations and magnitudes are less reliable, but includes more smaller earthquakes and man-made
events worldwide.
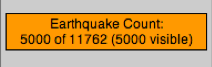
The Earthquake Count shows how many quakes were retrieved from the database, along with the total number of that could have been retrieved (but the limits of Maximum earthquakes setting prevented it). Since zooming and panning can hide some of the earthquakes, the number that are actually visible in the current map view is also given.
If the Earthquake Count reads "500 of 38738" then 500 quakes are on the map and 38,738 - 500 = 38,238 matched in the database but are not displayed. So although a huge number of quakes matched your Options filter, they were not retrieved, based on the Max quakes setting of 500. Which 500 of them were retrieved is based on the "Select Earthquakes By" setting.
If the counts are positive, but the number visible is zero, pan, zoom out, or use "Zoom to Region" if a region is currently selected. IEB prompts you if this condition arises. If all the values are zero, relax your filter settings in Options and press Apply.
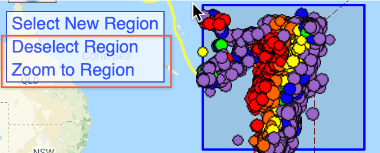
If you have selected a region using "Select New Region", then zooming and panning will not affect the set of earthquakes displayed, the set is "locked" until you either deselect the region or change filter options in the above right and press Apply.
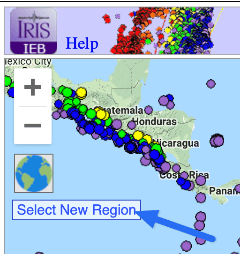
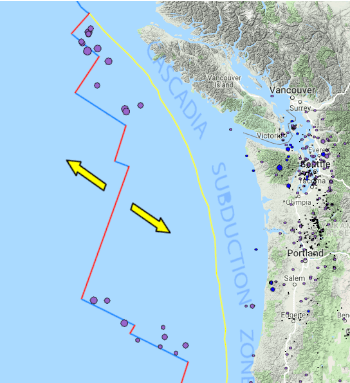
The region selection control allows you to quickly select a region and zoom there. Only events in the selected region will be shown.
To start, click Select New Region.
The cursor changes to a crosshair. Now drag from one corner to the opposite corner of the desired region and release.
Press the ESC key to cancel out of region select mode.
The event filter options will be freshly applied, but to the selected region only.
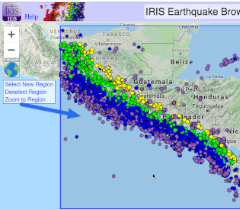
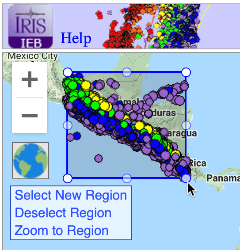
Next click Zoom to Region to zoom to the selected region.
When a region is selected, the events inside it are effectively 'frozen'. If you pan the map away or zoom too close, no events will be visible -- but IEB recognizes this condition and will prompt you what to do.
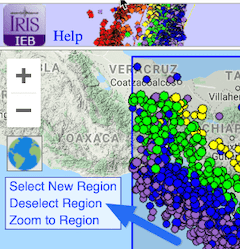
Click Deselect Region to remove the selection box and 'unfreeze' the events, so they once again auto update to reflect the visible map area as you zoom and pan.
You can immediately select a new region without deselecting the current one first.
IEB allows you to rotate thousands of earthquakes in any direction as well zoom in and out. It allows a better understanding of the spatial relationships in a set of earthquakes and often reveals a fault line or other underground feature only visible from a side view.
We thank the USGS, the NSF and EarthScope Consortium members for data, funding and support; original author B. Weertman, and Russ Welti for significant enhancements.