The GMV customization web interface is developed by IRIS DMC to allow users to create GMVs for events of interest that are not covered by the USArray GMV product or to create GMVs based on their own parameters. This document describes the elements of the customization web interface and highlights important points that users should consider when setting their customization parameters. To learn more about GMVs see the IRIS DMC's USArray GMV Data Product.
Customization User Interface (single-component GMV customization)
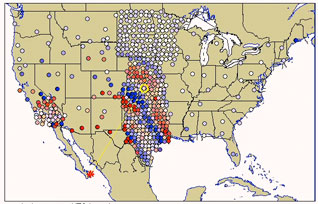
The GMV customization web interface consists of a form for entering the user-defined parameters (figure below, left) and a companion Google Map (figure below, right). The map is directly linked to various latitude/longitude boxes on the form to allow user to set the value of the location boxes by dragging the corresponding marker on the map and at the same time to allow users see the locations (latitude, longitude) that they enter directly into the location boxes. The user settable parameters on this form are grouped as described below the image.
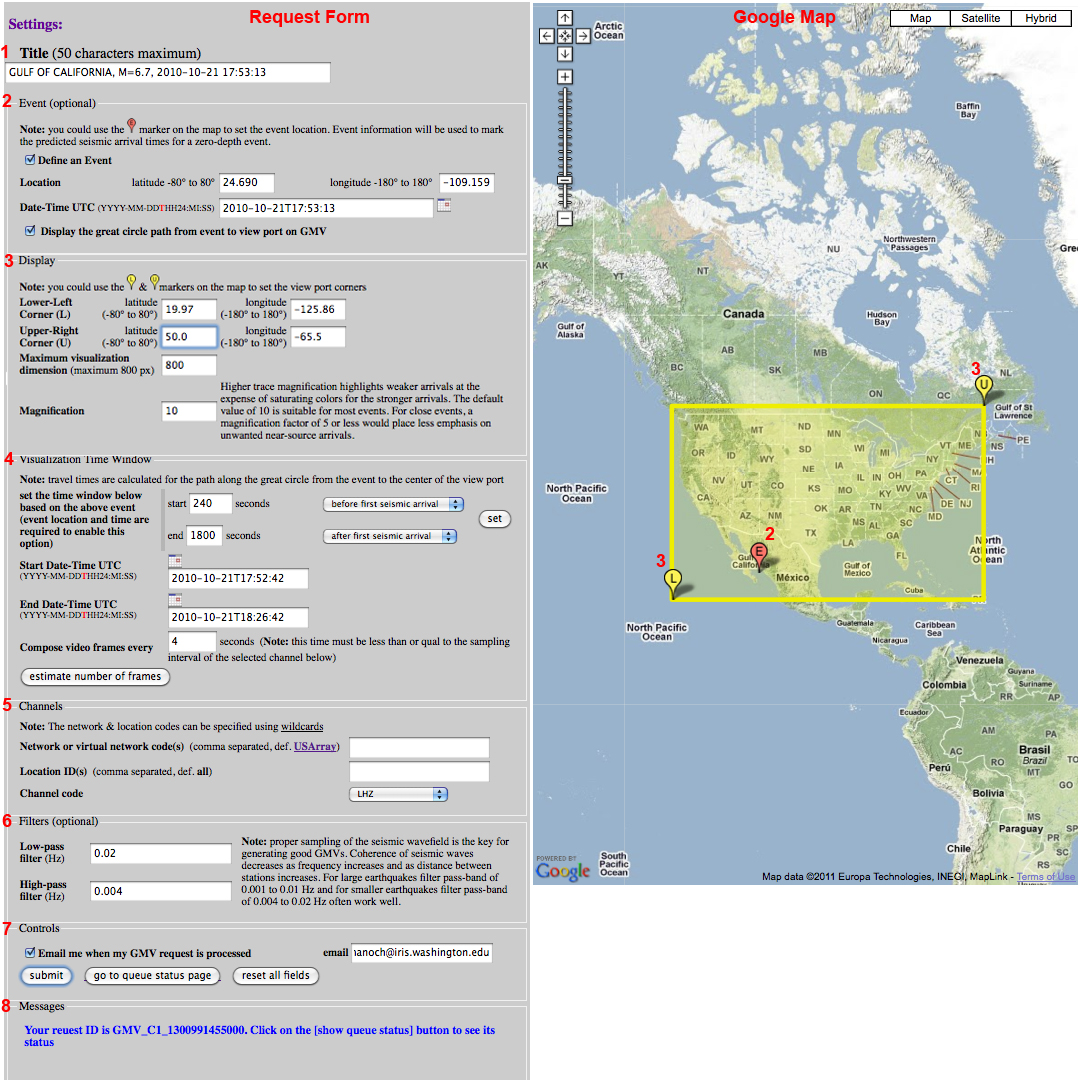
1. Title
The title box accepts a text string, 50 characters maximum, that will be placed directly above the GMV. |
  |
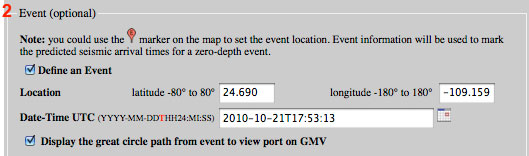
2. Event
Event definition is optional and if the Define an Event checkbox is checked, the event information will be used to mark the predicted arrival times for selected seismic arrivals on a reference seismogram below the GMV. In addition, user may request display of the great circle path, from event to the view port by checking the corresponding box. The event latitude and longitude must be entered using the -80/+80 and -180/+180 degree range respectively. The combined event date and time is in UTC and should be entered with a letter T separating the date and time (using the YYYY-MM-DDTHH24:MM:SS format). For example, for the October 21, 2010 Gulf of California event, the date and time is entered as 2010-10-21T17:53:13 |
  |
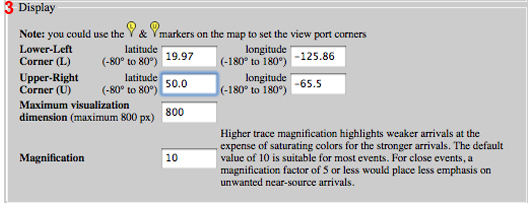
3. Display
Display options control how GMV is displayed. The display area is a geographic box defined by the coordinates (latitude ad longitude) of its lower-left and upper right corners (yellow region on Google Map above). This box will be used to limit the viewable part of the GMV. Any station that does not fall inside this box will not be included in the GMV, even though the station's data will be downloaded and processed as part of the GMV production. For a more efficient GMV generation, it is strongly recommended that, to the extent possible, request stations that fall within the view port. By default the view port is set to that of the USArry GMVs. |
  |
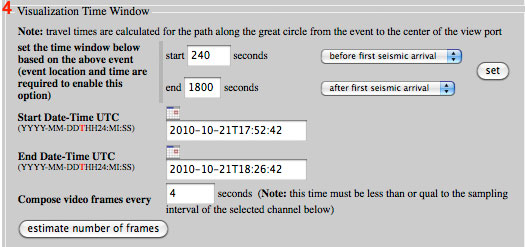
4. Visualization Time Window
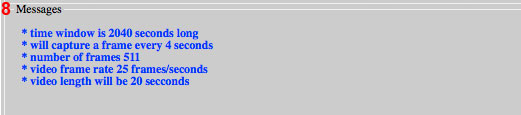
Visualization time window defines the beginning and end time of the GMV. User may type the desired date-time values directly in the Start Date-Time and End Date-Time boxes, or, if an event is defined on panel 2, then user may use the set button to define the GMV's start and end times based on the event and phase criteria selected. Each GMV is created by composing movie frames between the defined Start Date-Time and End Date-Time. The frequency of frame generation is controlled by the value set in the Compose video frames every text box. Increase this number to reduce the total number of frames in the movie but at the same time it should larger than the channel sample interval and be small enough to produce a smooth GMV. The default value for this parameter is one frame every 4 seconds. Once the desired parameters are set, click on estimate number of frames to view an estimate of the number of frames in the movie in the Message panel (see panel 8 below). |
  |
5. Channel
| User may limit the data used for creation of GMVs by specifying the desired network codes and location IDs. By default GMV is created using the LHZ channel of the USArray data. Use comma to separate individual network codes or channel IDs. Use of the wildcards (* to wildcard zero or more characters, ? to wildcard one character) for Network codes or location IDs is allowed. | 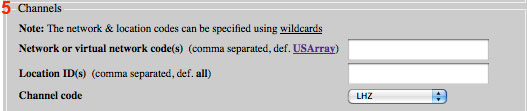 |
6. Filters
| Filters are optional and user may apply low-pass, high-pass or both low-pass and high-pass filter (to create a band-pass filter). The filter is a 4th-order Butterworth filter. Proper sampling of the seismic wavefield is the key for generating good GMVs. Coherence of seismic waves decreases as frequency increases and as distance between stations increases. For large earthquakes filter pass-band of 0.001 to 0.01 Hz and for smaller earthquakes filter pass-band of 0.004 to 0.02 Hz often work well. | 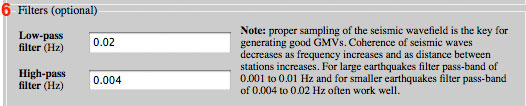 |
7. Controls
| To submit a GMV request, user should click on the submit button under the Controls section. Once the request is submitted, its status may be checked using the go to queue status page button. Depending on the volume of data included in the GMV, its production could take over an hour. It is highly recommend selecting the email notification option under the Controls section for an automated email notification when GMV processing is complete. | 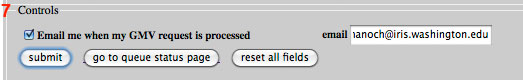 |
8. Messages
| All messages, including the GMV request ticket ID, will be posted on the Message box located at the bottom of the form. | 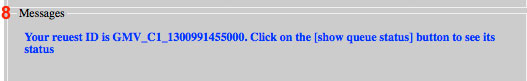 |