


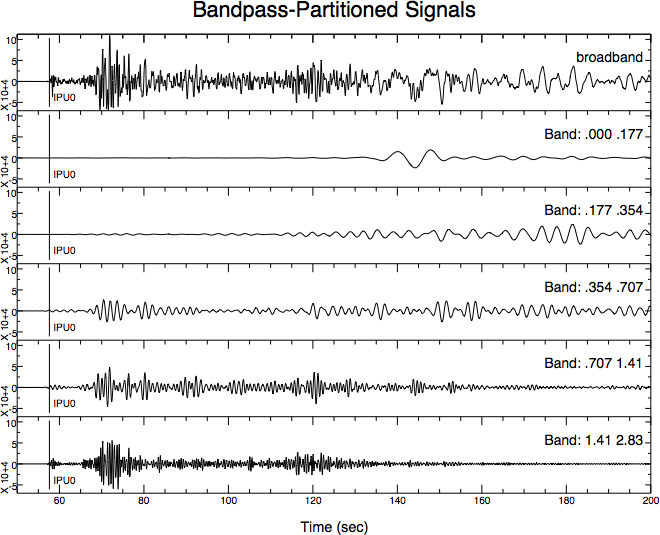
Figure 1: IIR filters applied to a waveform
The filters are causal, 3-ole Butterworth filters with corners as given in the plot labels. The routines used for the filtering have been possible in SAC for more than 20 years, but the fonts in the figures are true Postscript fonts, a feature added to SAC in v 101.5. The commands for producing this figure are in sac/macros/demo/filter.
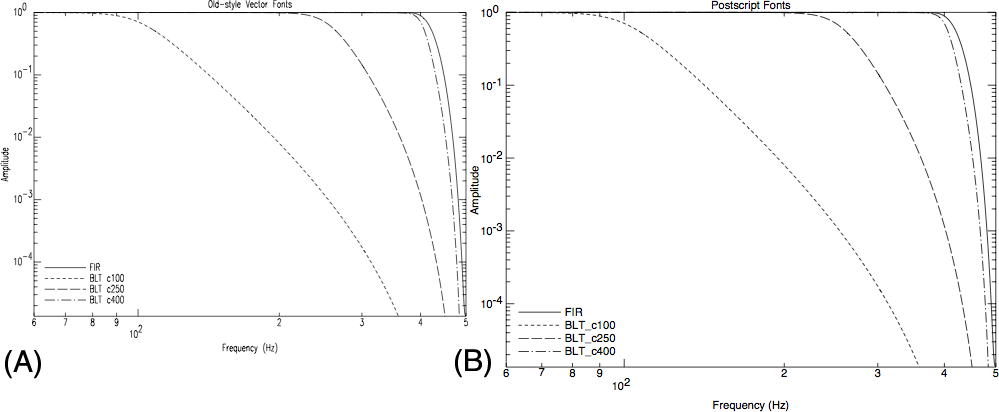
Figure 2: SAC font comparison
Comparison of the old-style vector-based fonts (A) and postscript fonts added in 101.5 (B). The plot is an amplitude vs. frequency plot of the FIR filter used to prepare an event waveform the and for Butterworth causal 6-pole low-pass filters with corners at 100~Hz, 250~Hz, and 400~Hz. The FIR amplitudes were calculated using program EVALRESP and the low-pass filters by SAC, which uses the bilinear transform so that the amplitude goes to zero at the Nyquist frequency (500~Hz).
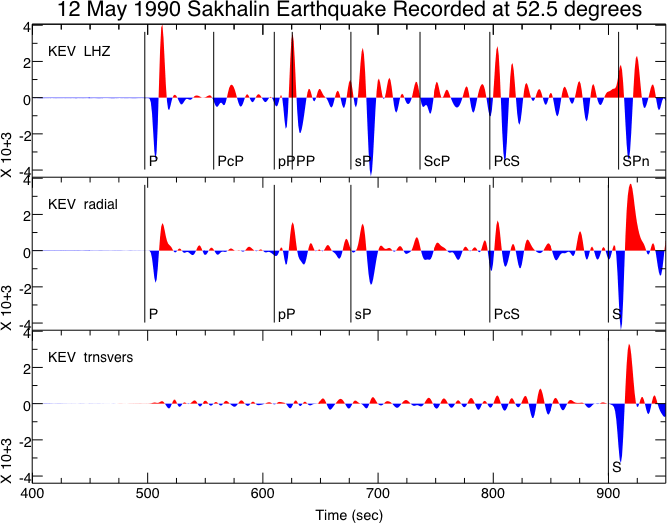
Figure 3: Example showing calculated phase arrival times and waveform fill
The phase arrival time picks were calculated using the SAC TRAVELTIME command (v101.5), and the positive and negative fills were added using the fill option to the line command (v101.6) — a feature long lacking in SAC. A possible seismology prelim question is to find the picked phase that cannot be correct. (The arrival time is correct, but there is another phase that comes in near the same time that is not included in the iaspei-tau tables used by TRAVELTIME for velocity model iasp91.)
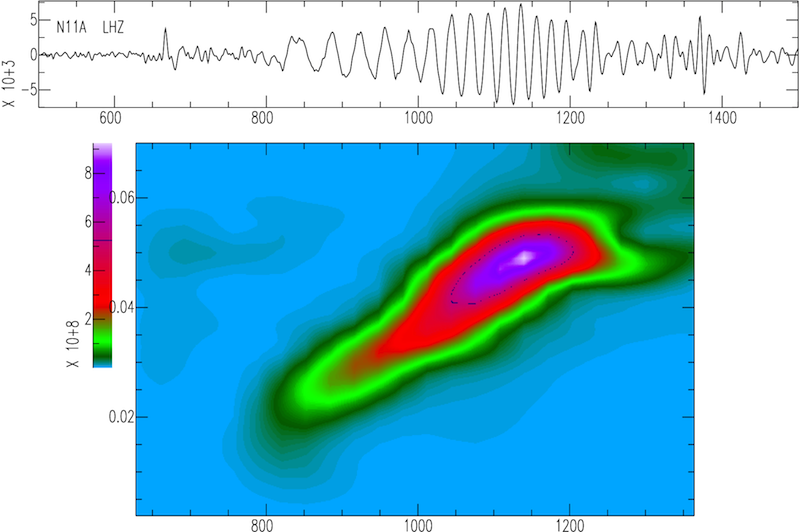
Figure 4: Example spectrogram
The spectrogram shown above is an example of the XYZ plots that can be done within SAC.


