This Special Event web page is intended to provide direct links to and images of data and materials available from SAGE programs and preliminary research results from the seismology community. We welcome any additional contributions containing original content that might be of interest to the research community. Please send them to the email address listed below.
SAGE does not necessarily endorse the views or scientific validity of the posted items.
November 30, 2018 17:29:28 UTC, M7.0 Southern Alaska earthquake (USGS Executive summary page)
Email contributions to:
special-events@lists.ds.iris.edu
Note:
All scientific contributions addressed to the community will be forwarded to the special-events mailing list.
If you DO NOT want your email being forwarded, please address it to SAGE or explicitly write
do not forward.
Quick Links
Figures 
[USGS Event KML] USGS ShakeMap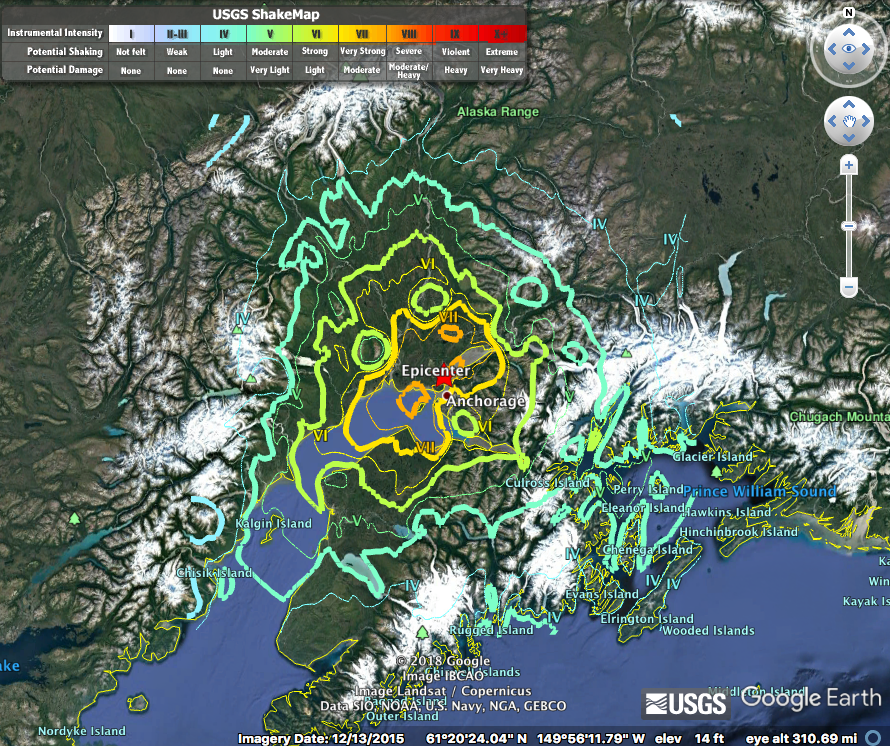
[GEOSCOPE Observatory] Automatic determination of source parameters using 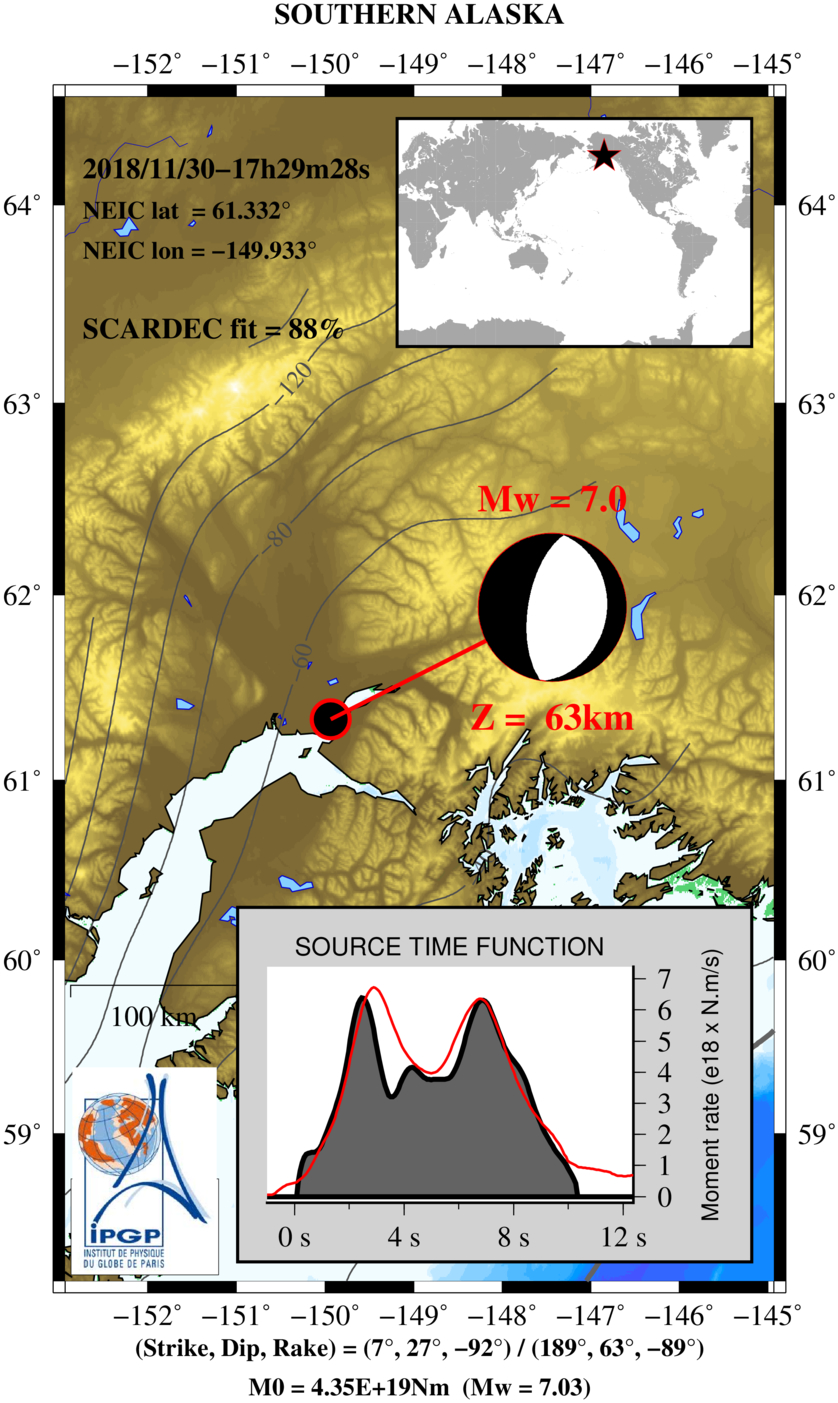
the SCARDEC method
[Alex Hutko, PNSN] Vertical displacement data across the N4 array 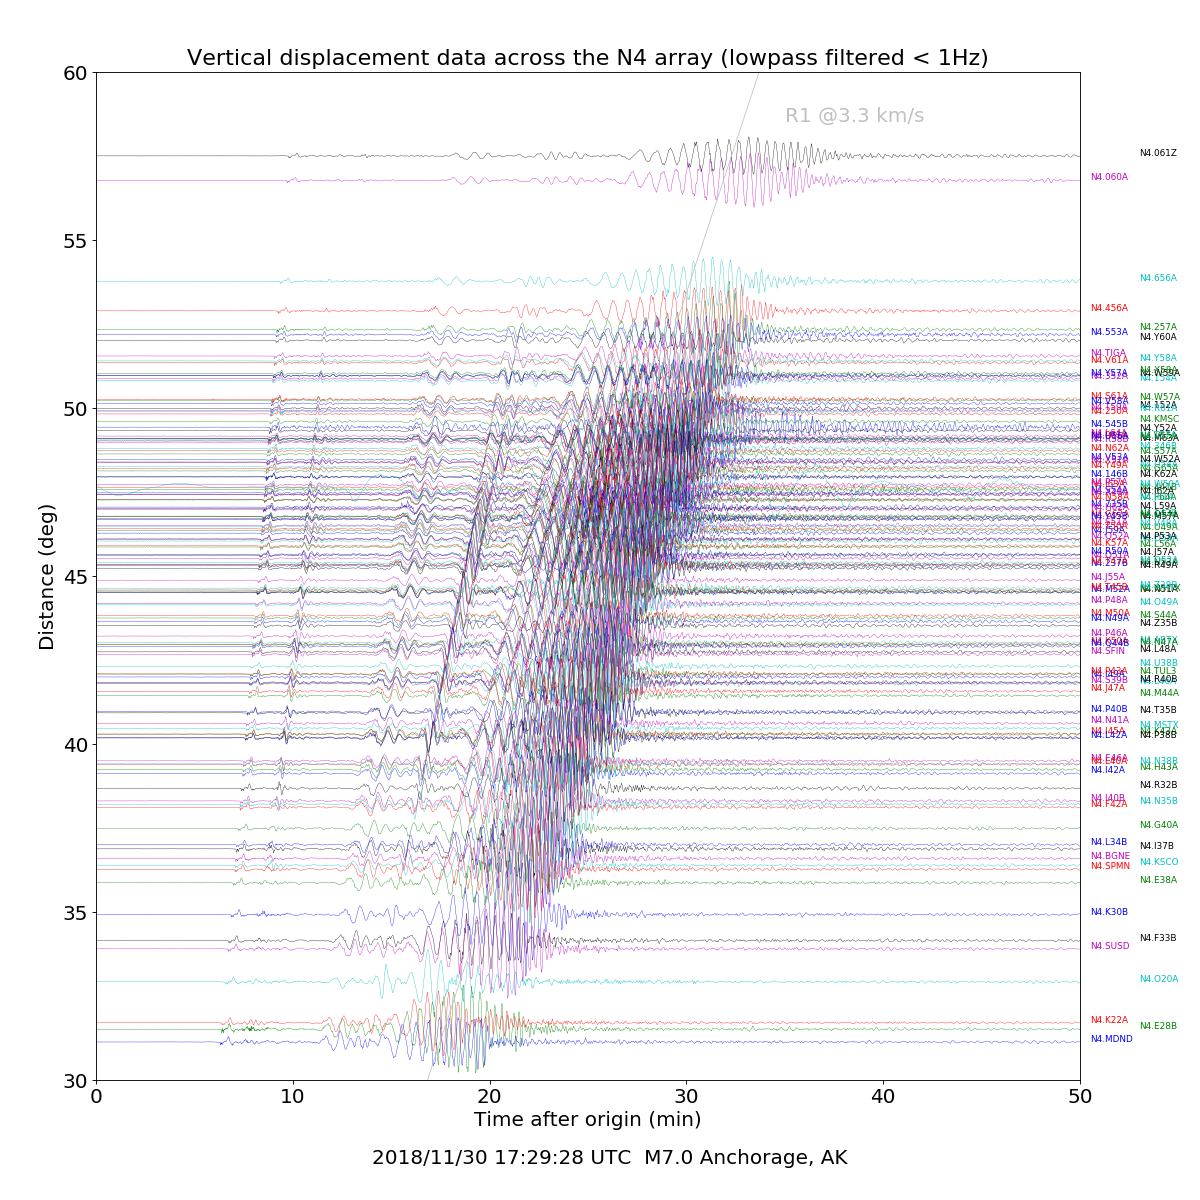
(lowpass filtered < 1Hz)
[Alex Hutko, PNSN] Vertical displacement data across TA in Alaska 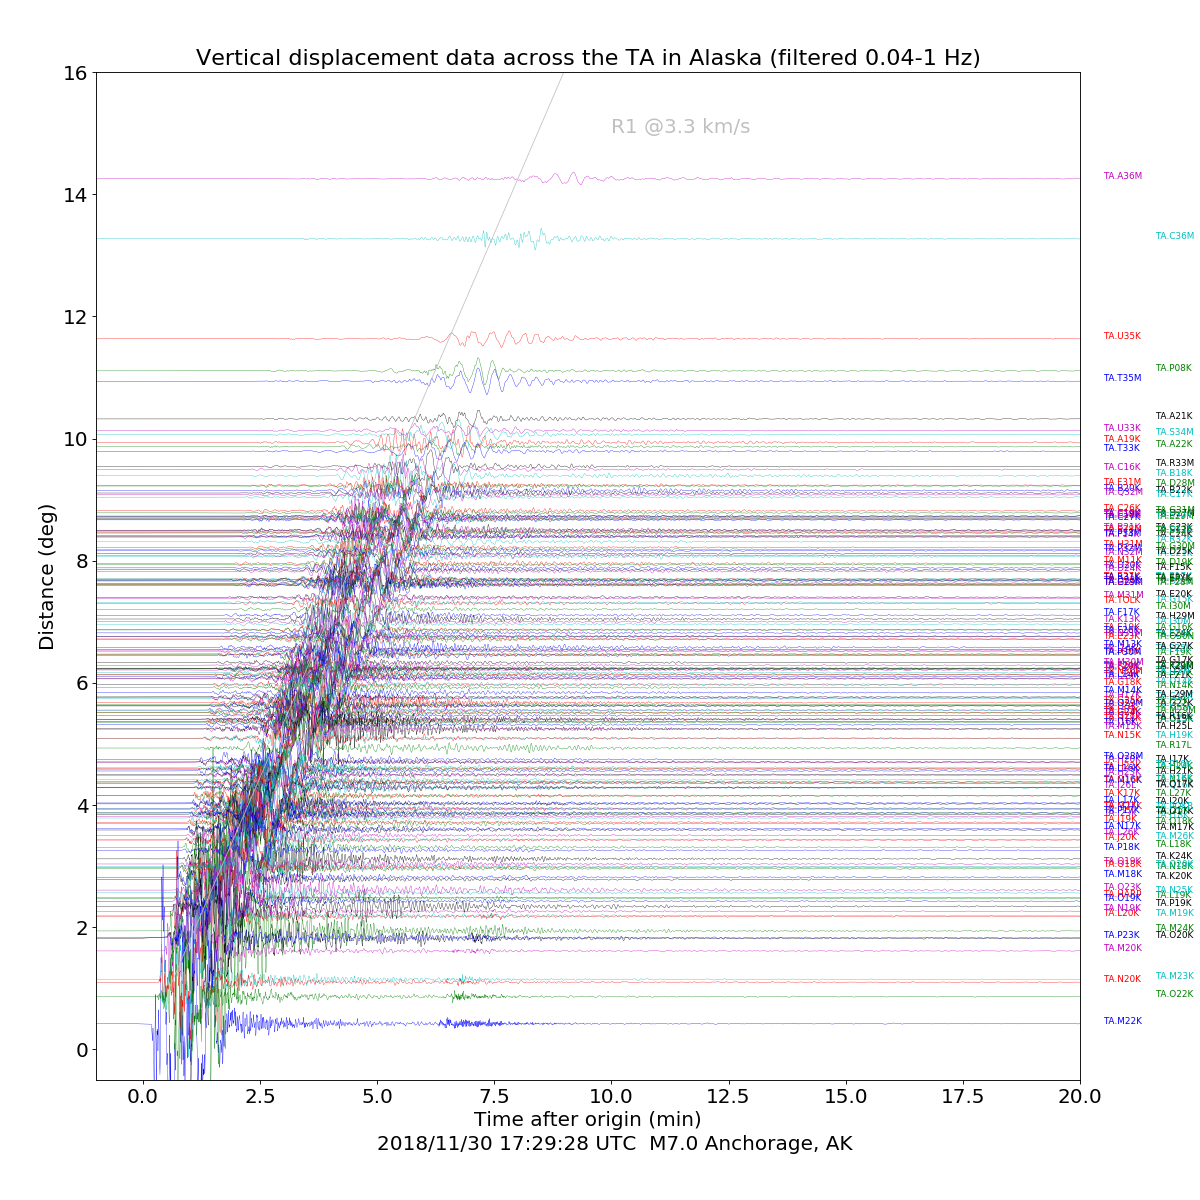
(filtered 0.04 – 1 Hz)
[Brendan Crowell, PNSN] Still preliminary results since they use IGS ultra-rapid 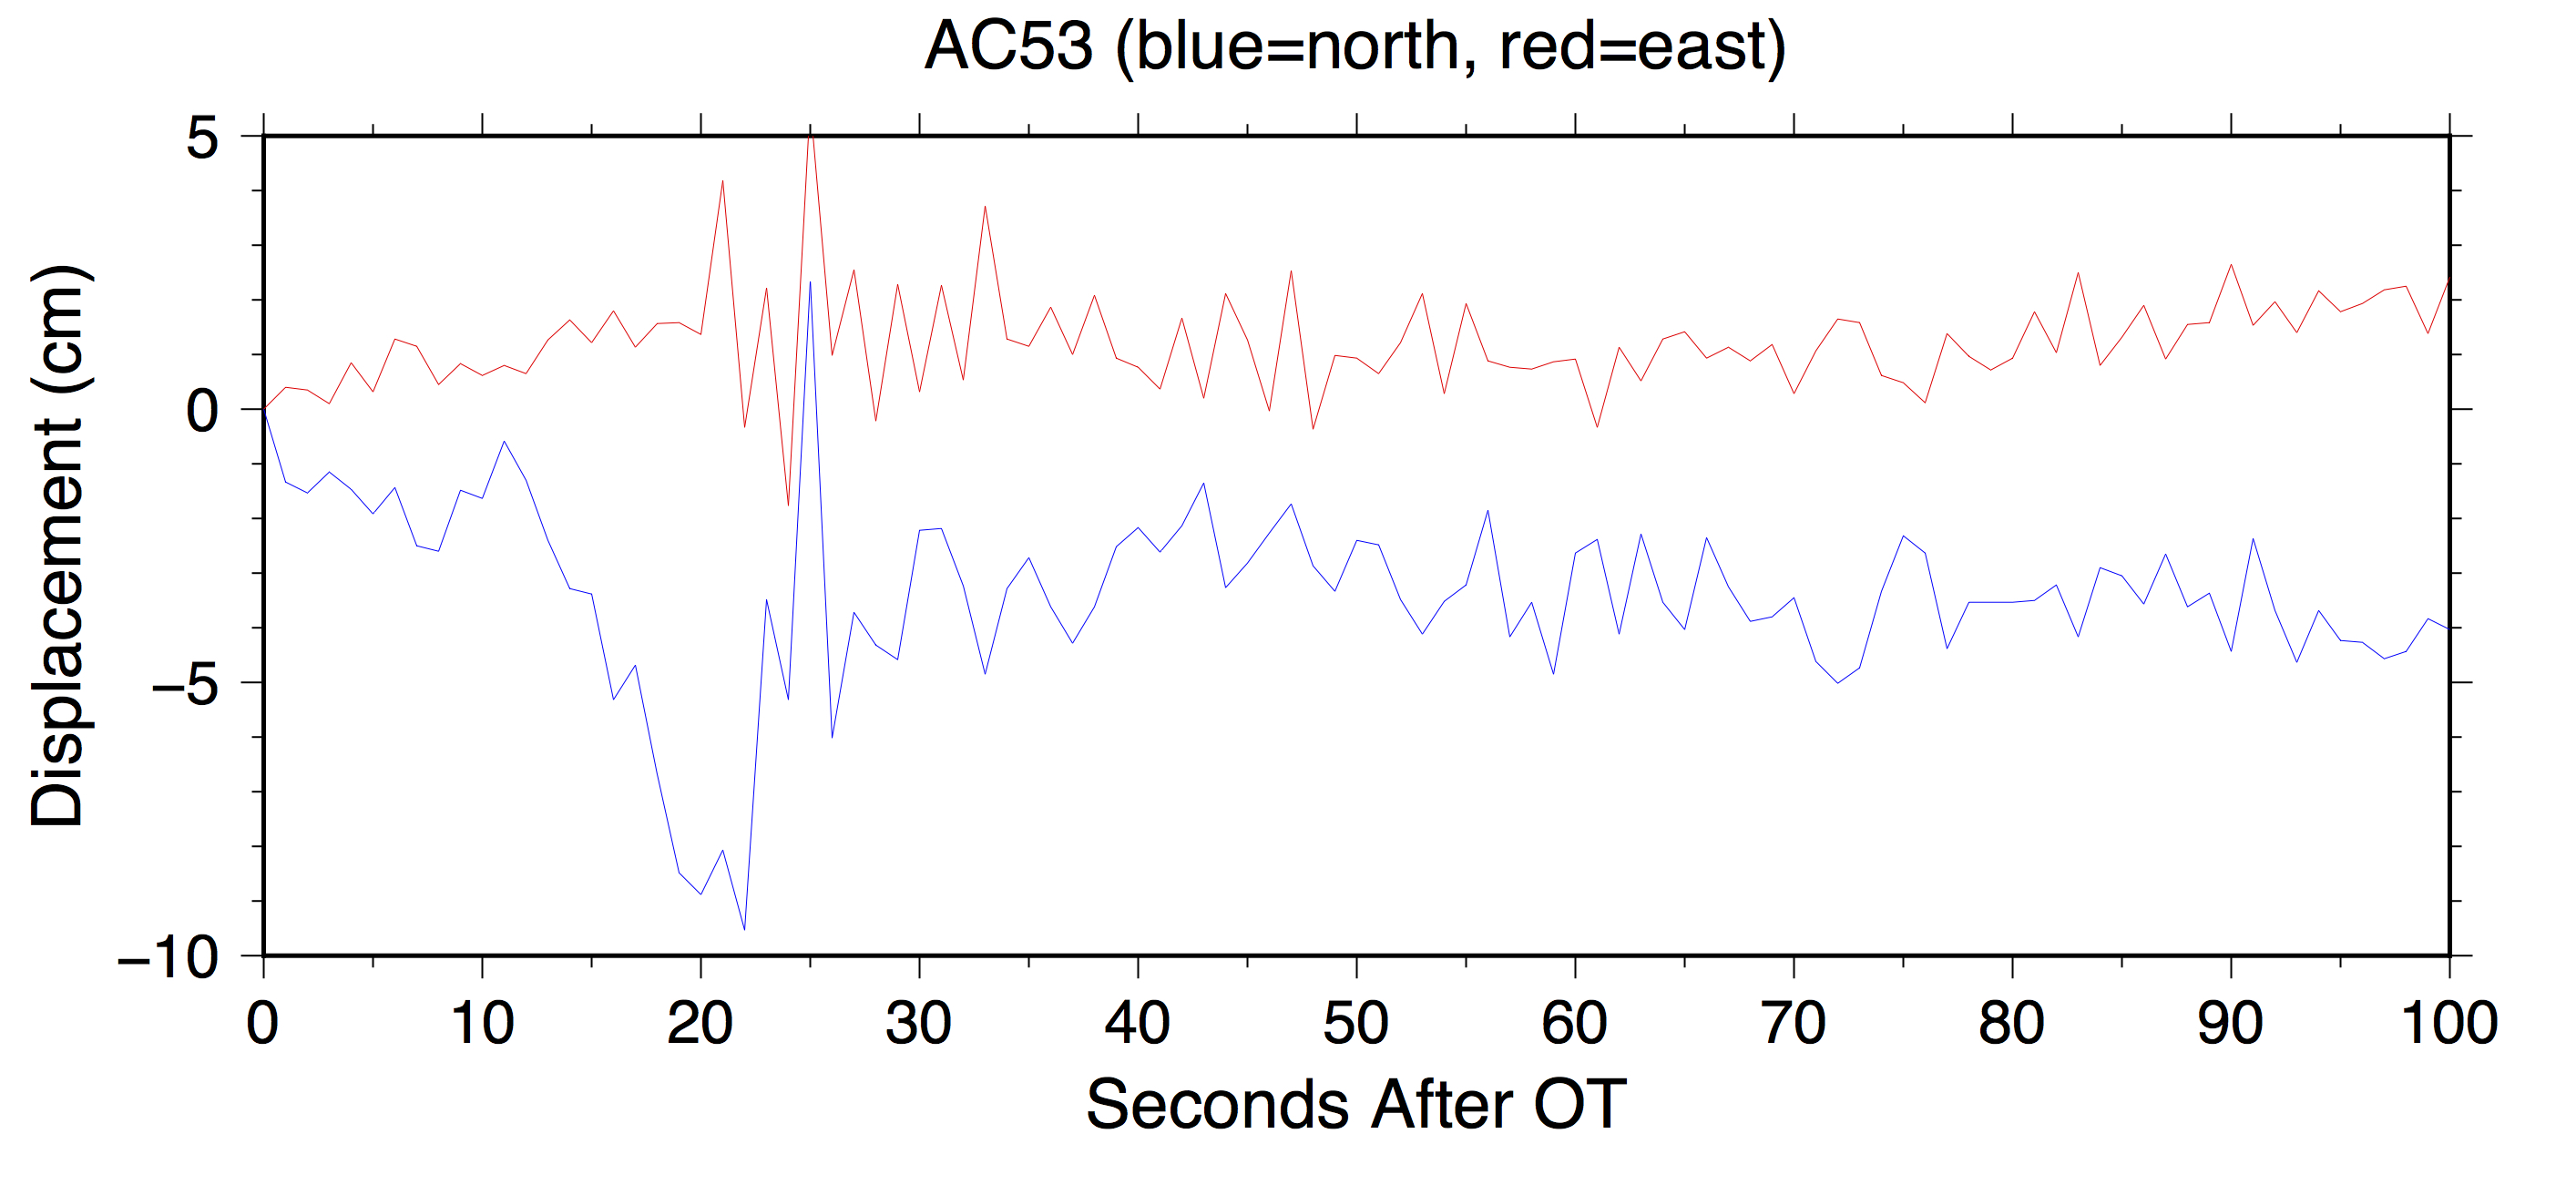
orbits, but they show some nice signals on the horizontals. Station AC53 is
roughly 50 km north of the event at 61.769N, 150.069W
[Brendan Crowell, PNSN] Still preliminary results since they use IGS ultra-rapid 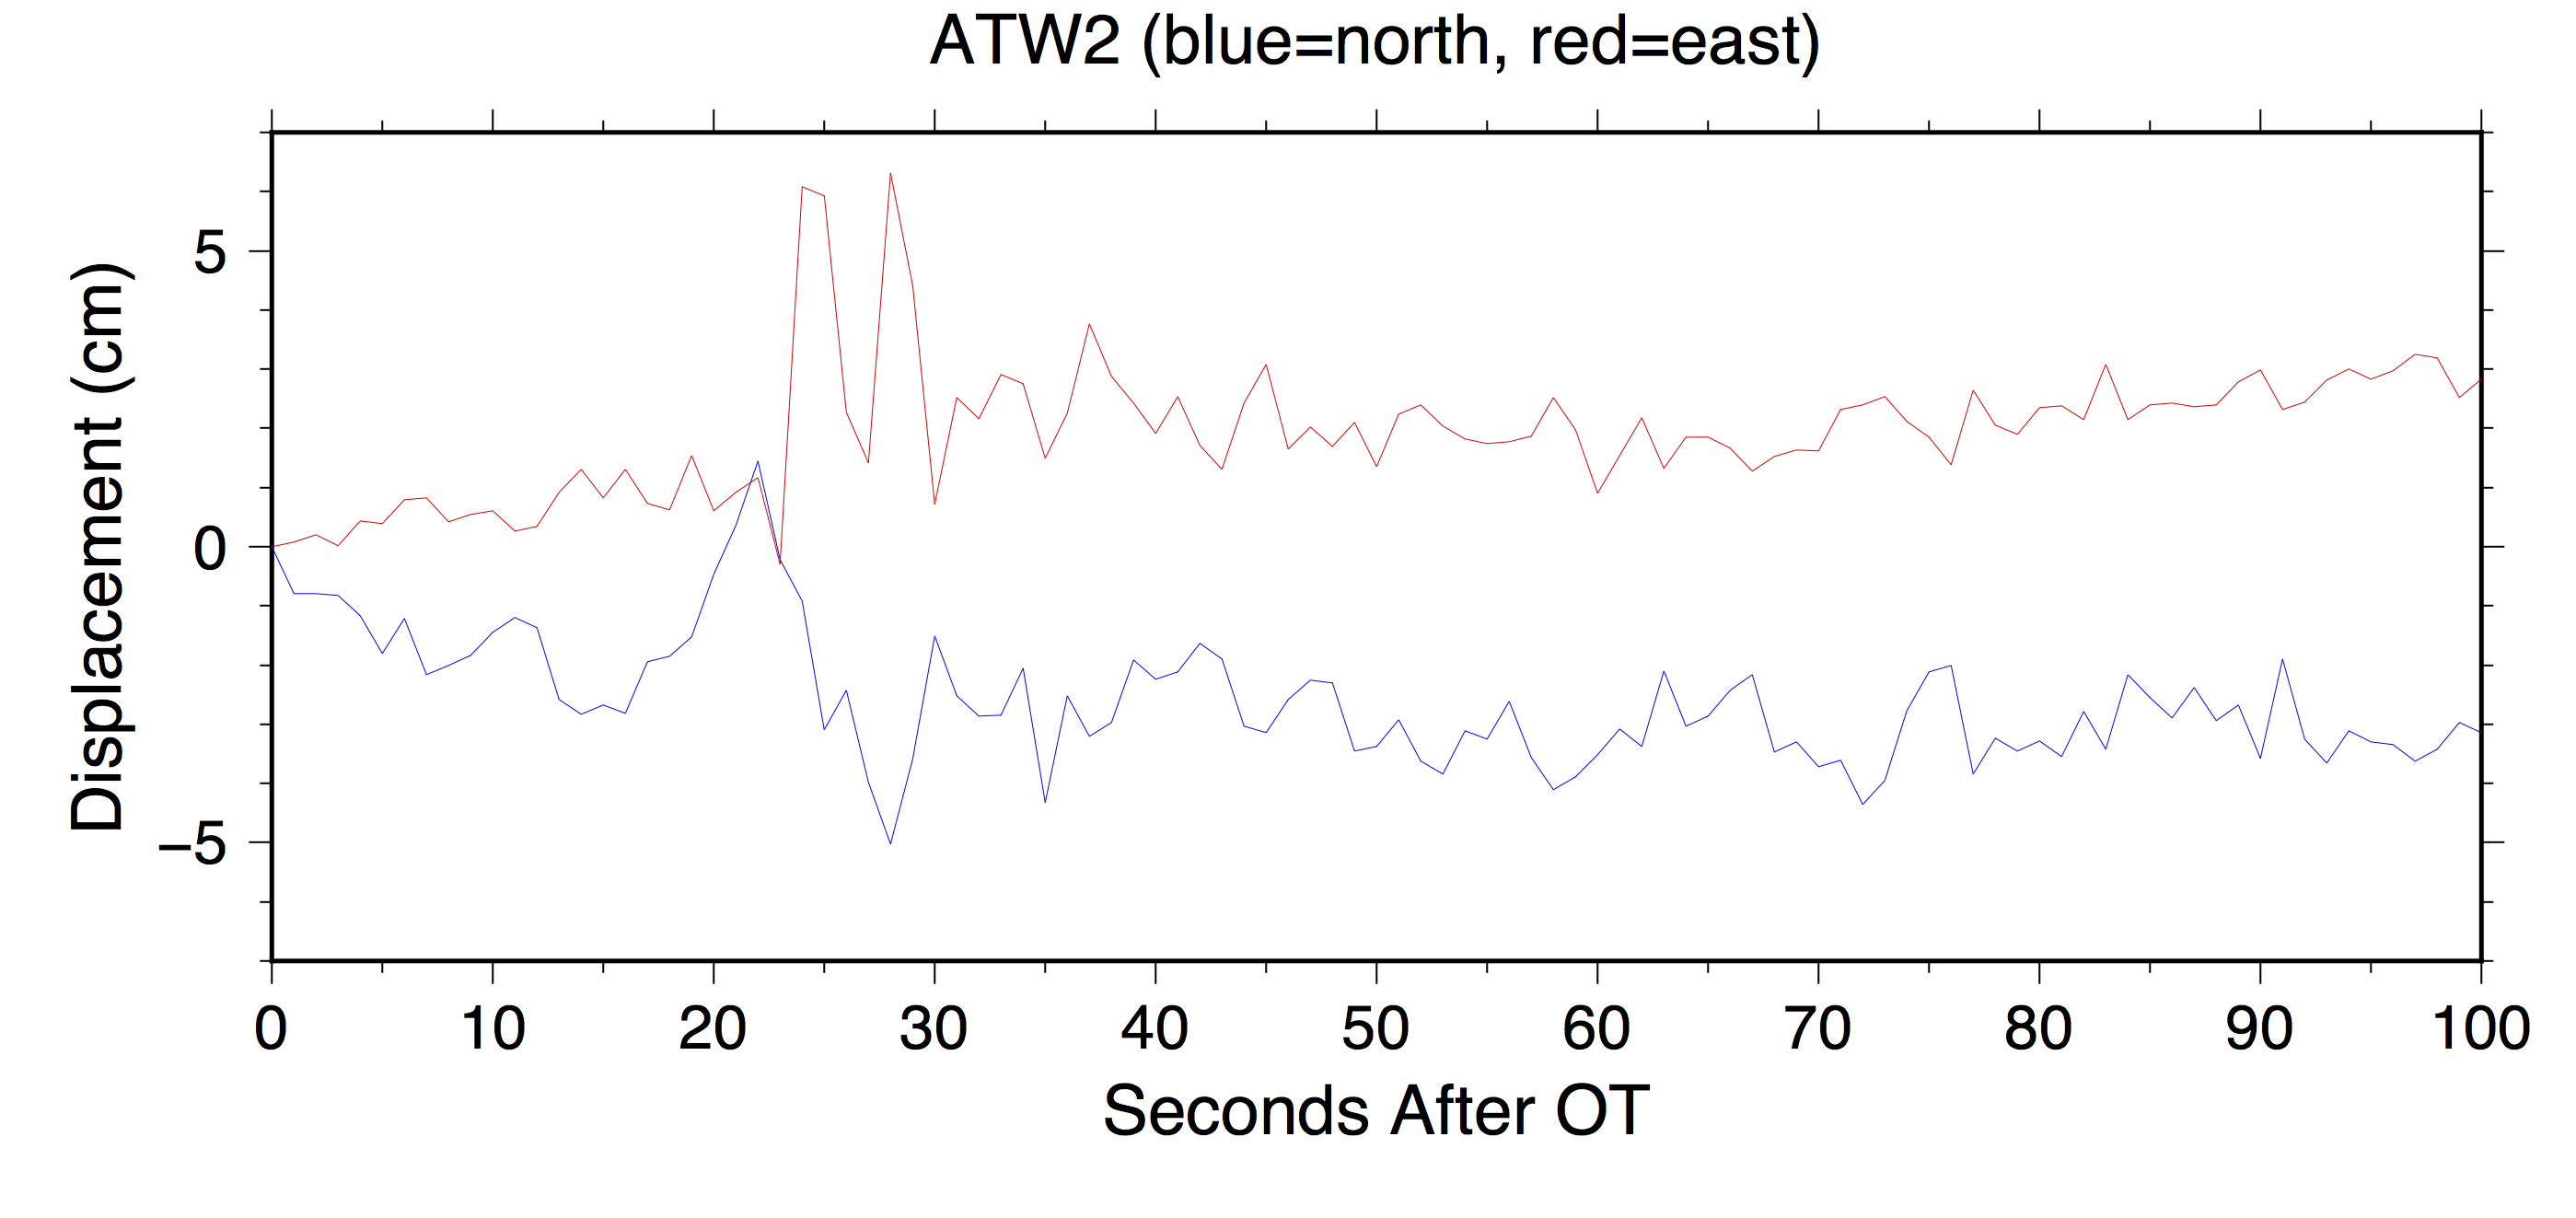
orbits, but they show some nice signals on the horizontals. Station ATW2 is
50 km NE of the event at 61.5978N, 149.1323W
[Afroz Shah, University Brunei Darussalam] The Mw 7.0 Earthquake of 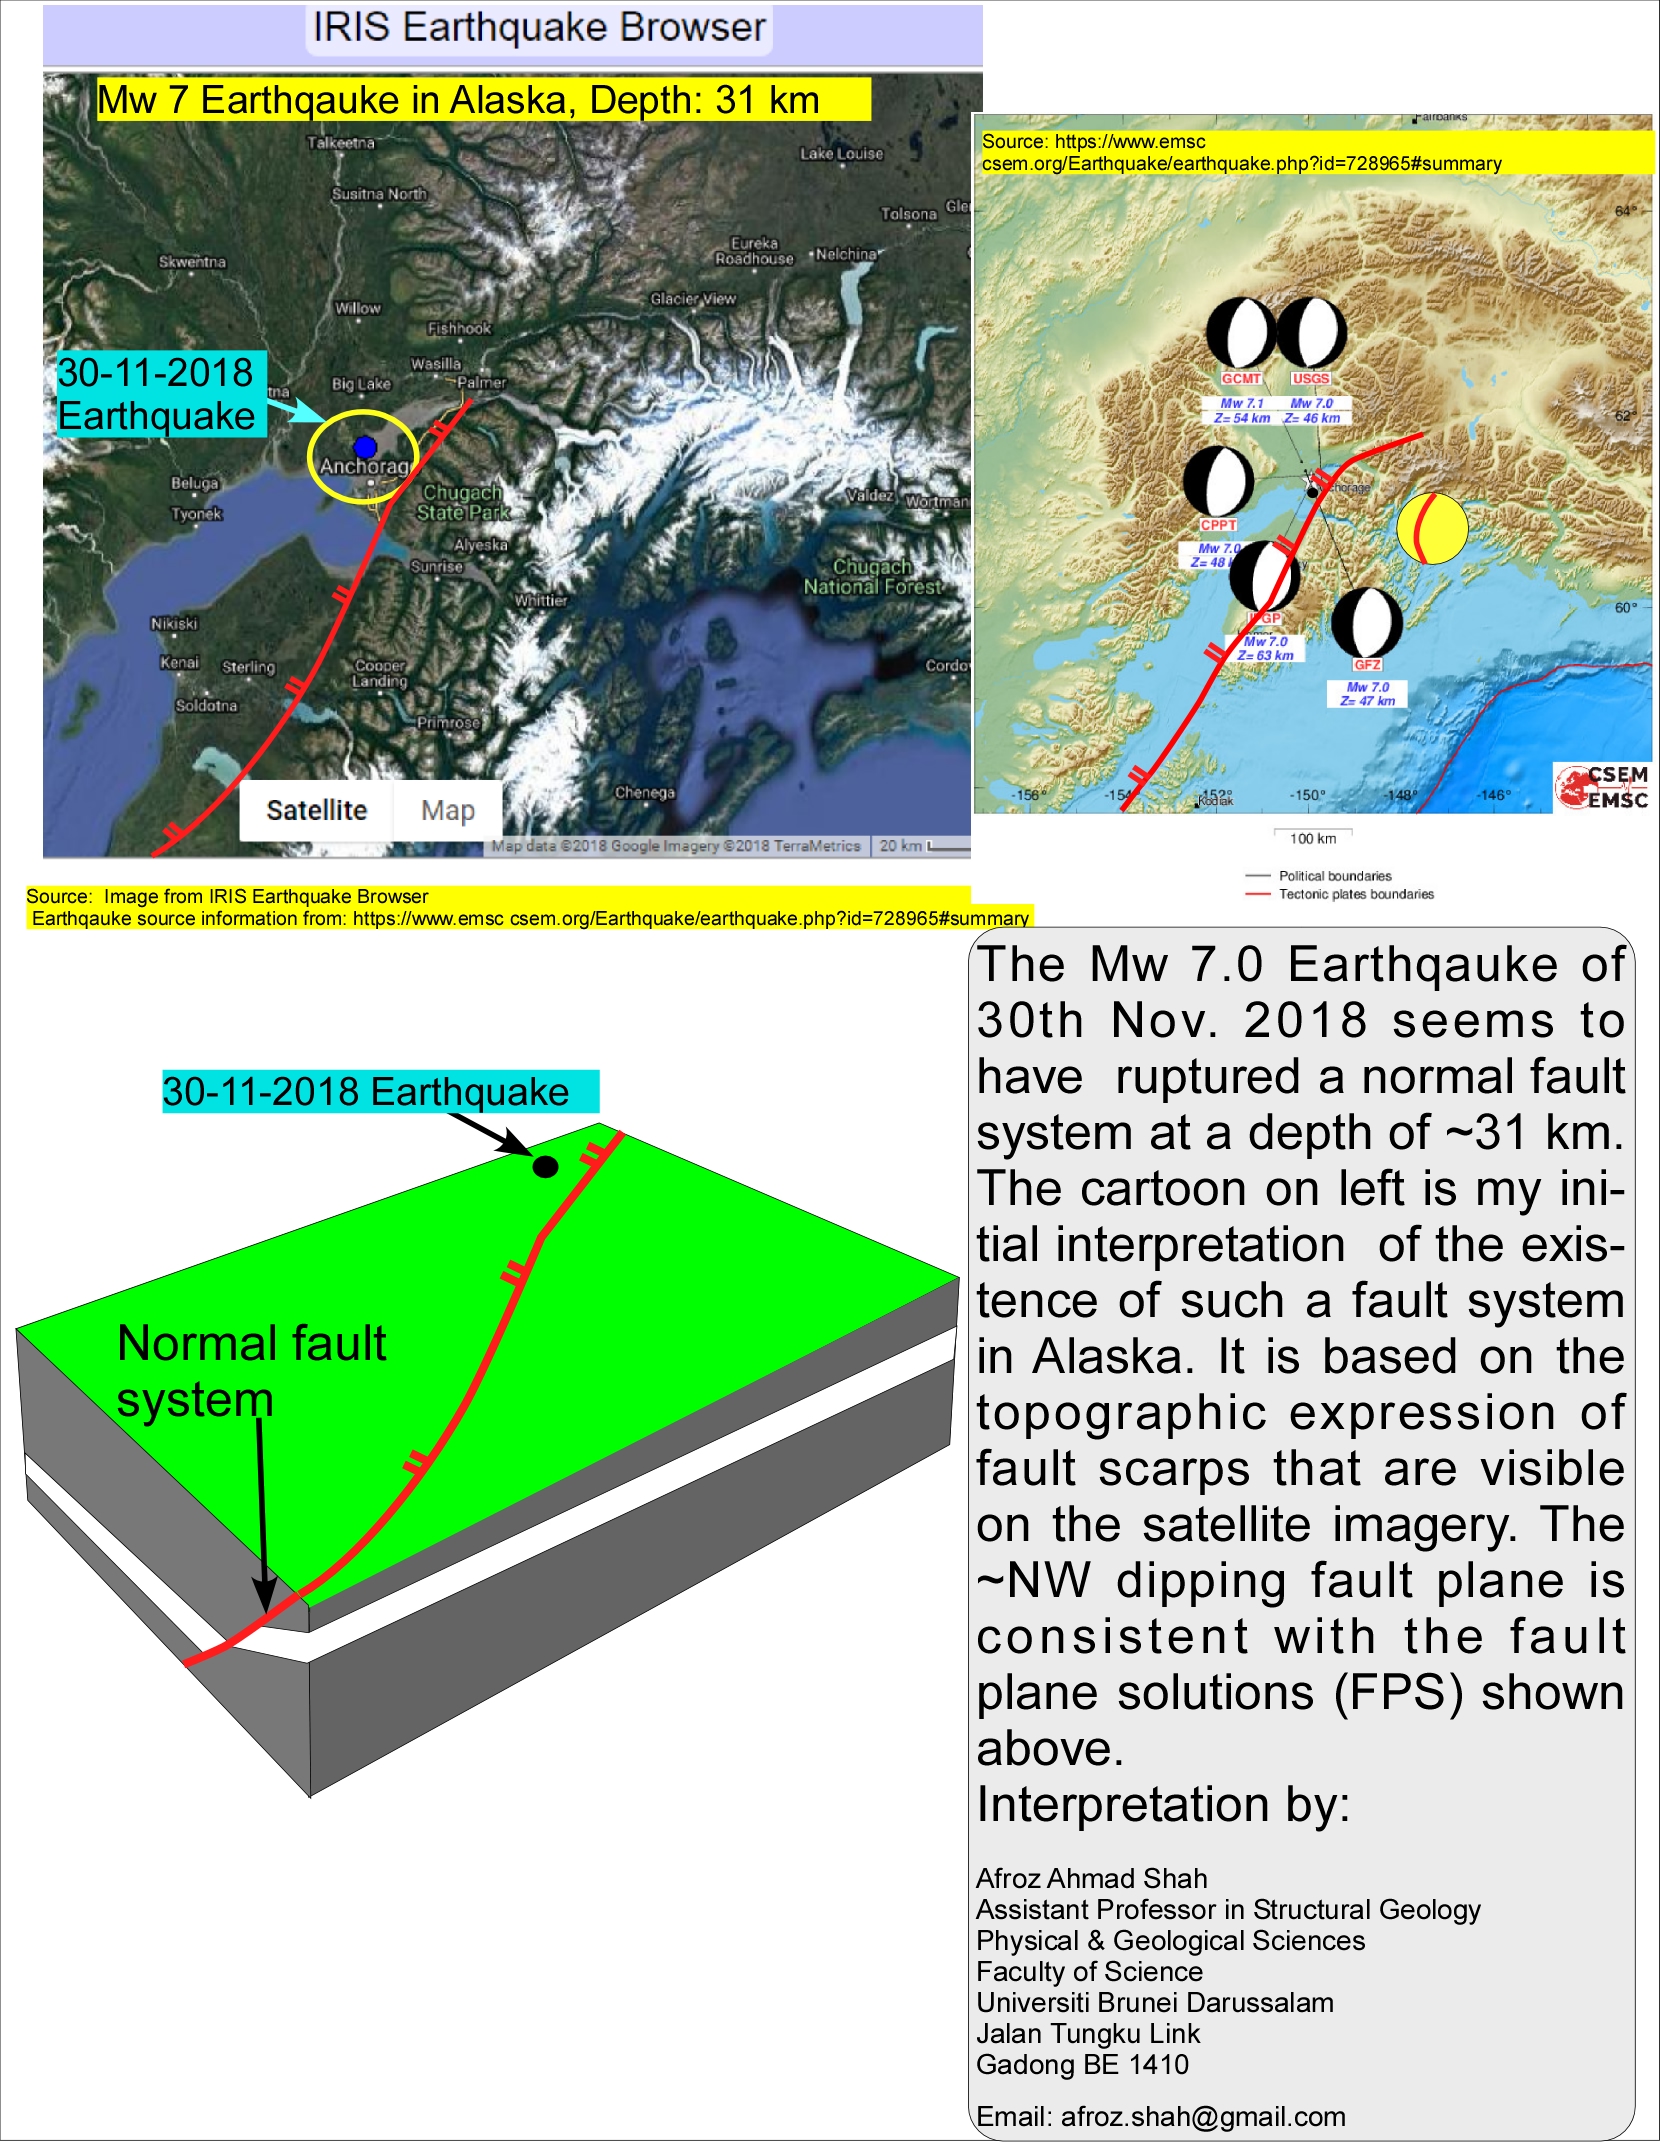
30th Nov. 2018 seems to have ruptured a normal fault system at a depth of
~31 km. The cartoon on left is my initial interpretation of the existence of
such a fault system in Alaska. It is based on the topographic expression of
fault scarps that are visible on the satellite imagery. The ~NW dipping fault
plane is consistent with the fault plane solutions (FPS) shown above.
[IRIS DMC Event Plots Product] Combined and aligned on origin 0.3 to 1.0 Hz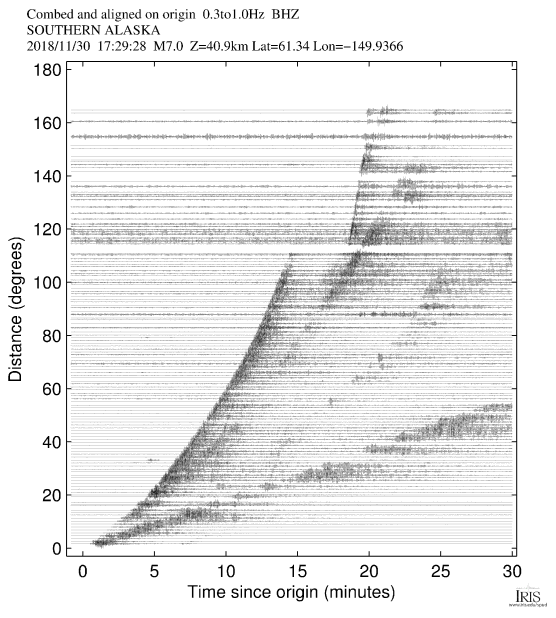
BHZ (click on image to access the EventPlots).
International Monitoring System (IMS) array IM.I53US 
Shahar Shani-Kadmiel(1,2), Jelle Assink(2), David Fee(3), and Läslo
Evers(2,1)
(1) Department of Geoscience and Engineering, Faculty of Civil Engineering
and Geosciences, Delft University of Technology.
(2) R&D Department of Seismology and Acoustics, Royal Netherlands
Meteorological Institute (KNMI).
(3) Wilson Alaska Technical Center and Alaska Volcano Observatory,
University of Alaska Fairbanks, Fairbanks, Alaska, USA.
Below are array-processing (Figure 1) and back-projection (Figure 2)
results using data from International Monitoring System (IMS) array
IM.I53US near Fairbanks, Alaska approximately 390 km away from the
epicenter. This is an array of 8 microbarometers that are sensitive to
mechanical vibrations as well as pressure fluctuations so both seismic and
acoustic arrivals are detected.
The raw waveforms are bandpass filtered between 0.3 and 5 Hz and the
instrument response is removed. A time-domain Fisher detector (
https://github.com/jdassink/beamforming) is used to beamform the data.
Array processing results show seismic detections with celerity (average
propagation velocity calculated as epicentral distance divided by travel
time) range of 6 to 2 km/s and similar apparent velocity (horizontal
propagation velocity over the array) range. Between 800 seconds and 1100
seconds after origin time, a coherent (high SNR) acoustic signal (apparent
velocity between 340 and 380 m/s) traverses the array with a stable
back-azimuth of ~212°. This signal has a peak-to-peak (pop) amplitude of
1.7 Pa. Between 1100 seconds and 1600 seconds the back-azimuth points to
~180° and the coherency is lower. Between 1600 seconds and 2500 seconds the
back-azimuth points to ~208°.
The travel time and back-azimuth information from beamforming is used to
back project the detections on a 0.05° by 0.05° grid and illuminate source
patches that radiate infrasound. A constant seismic propagation velocity of
4 km/s is assumed and is in agreement with the celerity value associated
with the arrival of the peak amplitude of the seismic wavetrain. Acoustic
propagation velocity is around 0.33 km/s and is corrected to account for
along- and cross-track wind. The coherent signal between 800 and 1100
seconds traces the Alaska Range north-west of the epicenter. The less
coherent signal between 1100 and 1600 seconds illuminates the steep
topography of the peninsula south-south-east of the epicenter. Finally, the
signal between 1600 and 2500 seconds illuminates the south-western flanks
of the Alaska Range.
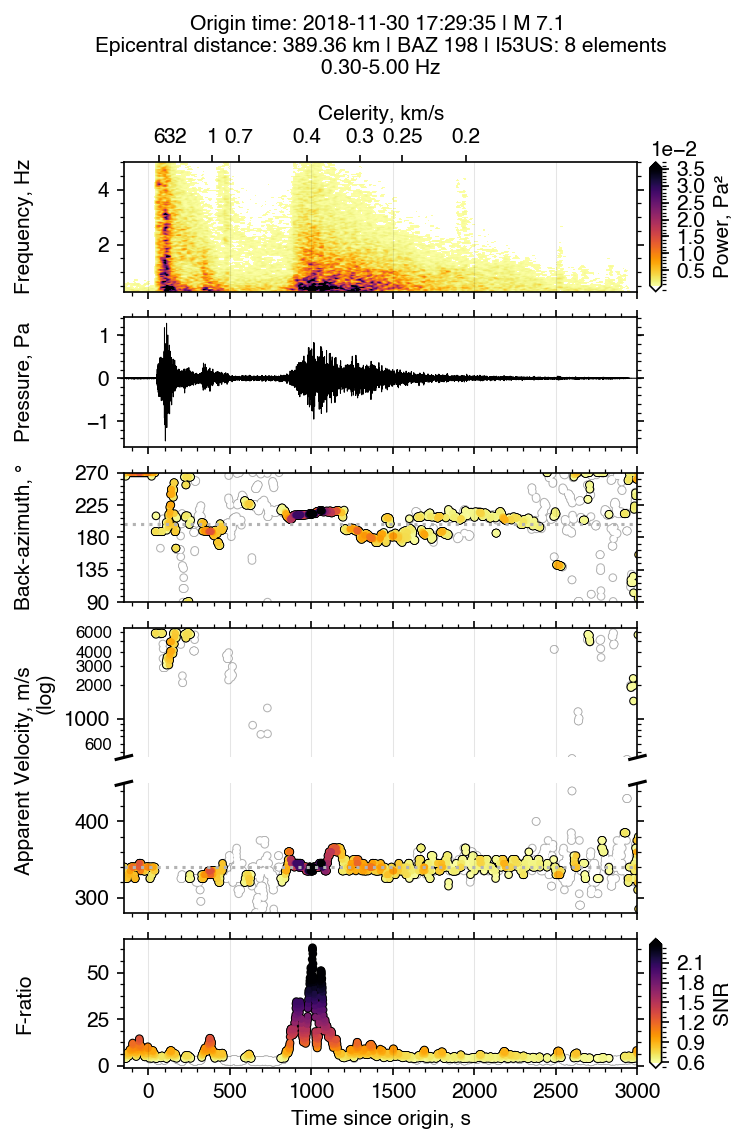
parameters as a function of time: Spectrogram of the best beam, best beam,
back-azimuth, apparent velocity (log scale above 450 m/s and linear below),
Fisher ratio. Scatter points colored by SNR of the detection. Celerity is
indicated on the top frame.
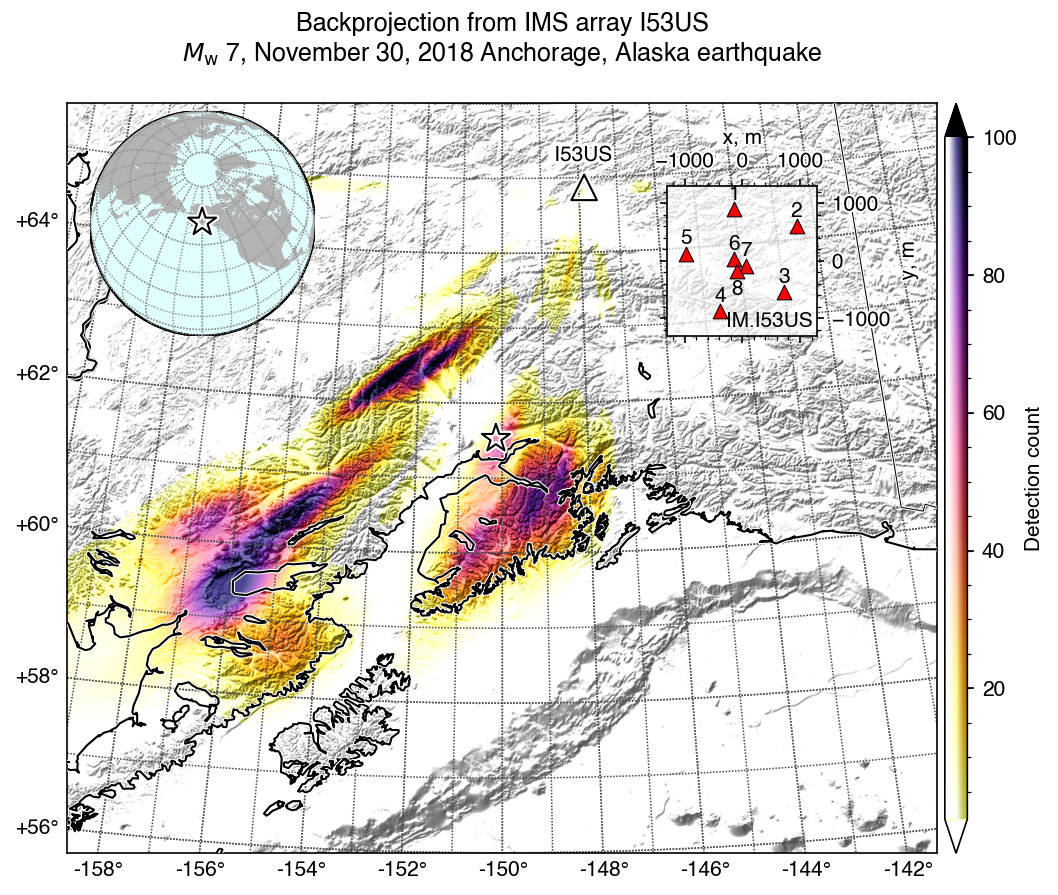
topography/bathymetry-shaded relief (the GEBCO_2014 30 arcsec
grid, Weatherall et al., 2015). The epicenter, is marked by a star; the
I53US array location is marked by a triangle and array configuration is
presented in the top right inset. Color coding by the number of detection
that originate in each grid cell.
Videos & Animations 
[Carl Tape, University of Alaska Fairbanks] Magnitude 7.0 Anchorage earthquake on
November 30, 2018 (computer simulation, zoom)
[Carl Tape, University of Alaska Fairbanks] Magnitude 7.0 Anchorage earthquake on
November 30, 2018 (computer simulation)
[Margarete A. Jadamec, The State University of New York at Buffalo] Here are three
virtual explorations of Wadati-Benioff zone geometry for the Alaska subduction zone
(Jadamec et al., Earth and Space Science, 2018). Zooming into the Earth starts at
about 30 seconds into the movies.
- Movie2_Alaska-Aleutian_v3:
https://ub.hosted.panopto.com/Panopto/Pages/Viewer.aspx?id=67a5fc45-3073-400f-b5b2-a8f400f8819c
- Movie3_Alaska-Aleutian-SlabComparison_v3:
https://ub.hosted.panopto.com/Panopto/Pages/Viewer.aspx?id=33af04d0-9459-4b46-942f-a8f400f6d0d5
- Movie1_GlobalSlabGeometries_v3:
https://ub.hosted.panopto.com/Panopto/Pages/Viewer.aspx?id=f001a1bb-8084-409a-80d7-a8f400f4dd82
Article citation:
Jadamec, M. A., O. Kreylos, B. Chang, K. M. Fischer, and B. M. Yikilmaz. A Visual
Survey of Global Slab Geometries with ShowEarthModel and Implications for a
Three-dimensional Subduction Paradigm. Earth and Space Science, vol. 5, 18 pp.
doi:10.1002/2017EA000349, 2018.
Video download for full 16 movie collection: http://hdl.handle.net/10477/76912.
Video stream: http://goo.gl/Y7PDEX.
In addition, here are two virtual voyages through the laterally variable Pacific
and North American plate thermal structure designed for 3D geodynamic modeling
of the region, based on a synthesis of observations.
Movie of 3D model of geographically referenced thermal structure with slow zooming
(Haynie and Jadamec, Tectonics, 2017):
https://ub.hosted.panopto.com/Panopto/Pages/Viewer.aspx?id=cb858c49-b12a-4e4f-bbe3-a9ab01541e6e
Movie of 3D geodynamic modeling results with audio explaining the interaction with
the Pacific and North American structure (Jadamec et al., Earth and Planetary Science
Letters, 2013):
https://ub.hosted.panopto.com/Panopto/Pages/Viewer.aspx?id=667c9ac9-aa2f-49b1-8754-a9ab0153d29b
Slab E115 (from Jadamec and Billen, 2010) can be downloaded here:
http://www.acsu.buffalo.edu/~mjadamec/alaska1.html
Links 

- IRIS Earthquake Sci, @IRIS_EPO
- Alaska Earthquake Center, @AKEarthquake
- NWS Tsunami Alerts, @NWS_NTWC
- Lassina Zerbo, CTBTO, @SinaZerbo
- UNAVCO, @UNAVCO
- Stephen Hicks, @seismo_steve
- Anthony Lomax, @ALomaxNet
- Jascha Polet, @CPPGeophysics
Related Content
These other pages were tagged similarly:
- Gulf of Alaska [Special Event: 2018-01-23]
- Central California [Special Event: 2019-07-04]
- Hawaii [Special Event: 2018-05-04]
- Northern Peru [Special Event: 2019-05-26]
- Generalized GMVs: post-TA ground motion visualizations [Newsletter Article: 2025-12-28 Vol. 22, Num. 2]
- 2017 North Korean nuclear test [Special Event: 2017-09-03]
- Are You Ready? Introducing Research Ready Data Sets (RRDS) [Newsletter Article: 2018-03-26 Vol. 20, Num. 1]
- GMV2 [Product]
- 2016 North Korean nuclear test [Special Event: 2016-01-05]
- South Island, New Zealand [Special Event: 2016-11-13]


