Summary
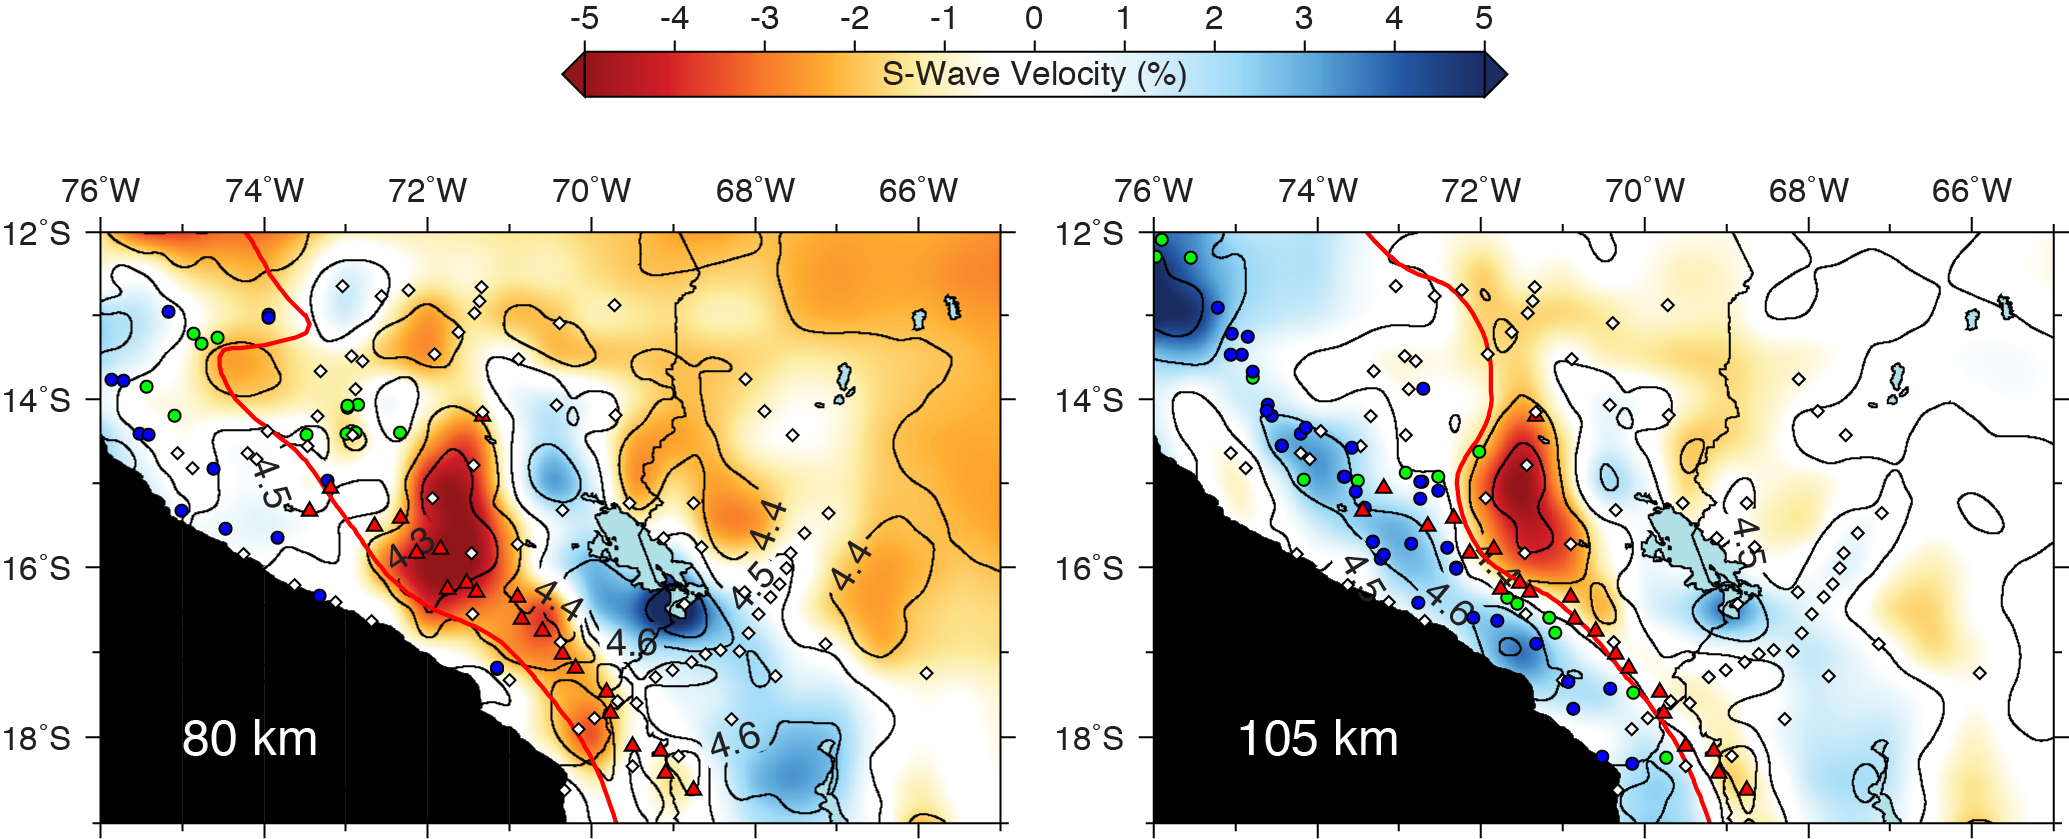
3D shear-wave velocity model of the Bolivian Orocline (BO) from the joint inversion of ambient noise tomography and two-plane wave tomography
Quicklinks
Description
| Name | BO.ANT+TPWT.Ward.2016 |
| Title | 3D shear-wave velocity model of the Bolivian Orocline (BO) from the joint inversion of ambient noise tomography and two-plane wave tomography. |
| Type | 3-D Tomography Earth Model |
| Sub Type | Shear-wave velocity (km/s) |
| Year | 2016 |
| Short Description | The model incorporates seismic data from an earlier ambient noise tomography study (Ward et al., 2013) with two-plane wave tomography to image the shear wave velocity structure of the Bolivian Orocline (BO) from the joint inversion of ambient noise and earthquake generated surface waves. |
| Authors: | |
| Kevin M. Ward | |
| Department of Geosciences | |
| The University of Arizona | |
| 1040 E. 4th Street Tucson, AZ 85721, USA | |
| George Zandt | |
| Department of Geosciences | |
| The University of Arizona | |
| 1040 E. 4th Street Tucson, AZ 85721, USA | |
| Susan L. Beck | |
| Department of Geosciences | |
| The University of Arizona | |
| 1040 E. 4th Street Tucson, AZ 85721, USA | |
| Lara Wagner | |
| Department of Terrestrial Magnetism | |
| Carnegie Institution of Washington | |
| Washington, District of Columbia, USA | |
| Hernando Tavera | |
| Instituto Geofisico Del Peru | |
| Calle Badajo No. 169, Urb. Mayorazgo IV Etapa, Lima, Peru | |
| Previous Model | None |
| Reference Model | None |
| Model Download | BO.ANT+TPWT.Ward.2016_kmps.nc (see metadata ), is the netCDF file for the model |
| Model Homepage | |
| Depth Coverage | 0 to 200 km (bsl) |
| Area | The Bolivian Orocline (latitude: 12°S/19°S, longitude: 76°W/65W°) |
| Data Set Description | [[Ward et al., (2016)] The dataset includes the absolute S-wave velocity structure across the Bolivian Orocline (BO) from the joint inversion of ambient noise tomography and two-plane wave tomography. |

Citations and DOIs
To cite the original work behind this Earth model:
- Ward, K. M., Zandt, G., Beck, S. L., Wagner, L. S., and Tavera, H., (2016), Lithospheric structure beneath the northern Central Andean Plateau from the joint inversion of ambient noise and earthquake-generated surface waves, Journal of Geophysical Research: Solid Earth. https://doi.org/10.1002/2016JB013237.
To cite IRIS DMC Data Products effort:
- Trabant, C., A. R. Hutko, M. Bahavar, R. Karstens, T. Ahern, and R. Aster (2012), Data Products at the IRIS DMC: Stepping Stones for Research and Other Applications, Seismological Research Letters, 83(5), 846–854, https://doi.org/10.1785/0220120032.
DOI for this EMC webpage:
References
Hayes, G. P., D. J. Wald, and R. L. Johnson (2012), Slab1.0: A three-dimensional model of global subduction zone geometries, J. Geophys. Res., 117, B01302, https://doi.org/10.1029/2011JB008524.
Kumar, A., L. S. Wagner, S. L. Beck, M. D. Long, G. Zandt, B. Young, H. Tavera, and E. Minaya (2016), Seismicity and state of stress in the central and southern Peruvian flat slab, Earth Planet. Sci. Lett., 441, 71–80, https://doi.org/10.1016/j.epsl.2016.02.023.
Credits
Model provided by Kevin M. Ward
Timeline
- 2017-01-31
- Added


