Summary
NEUS-Vs2018 (Yang and Gao, 2018) is a 3-D shear-wave isotropic model for the northeastern United States from full-wave ambient noise tomography with resolvable depths down to 120 km.
Quicklinks
Description
| Name | NEUS-Vs2018 |
| Title | 3-D shear-wave isotropic model for the northeastern United States from full-wave ambient noise tomography |
| Type | 3-D Tomography Earth Model |
| Sub Type | Shear-wave velocity (km/s) |
| Year | 2018 |
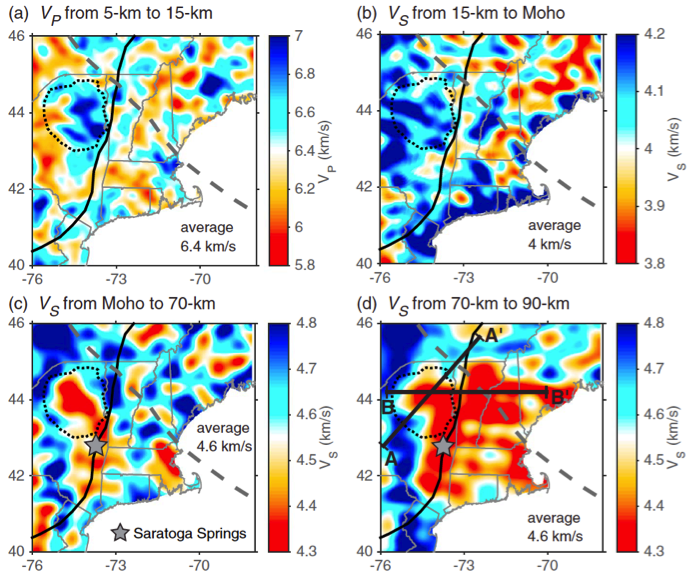
| Short Description | NEUS-Vs2018 is a 3-D shear-wave isotropic model for the northeastern United States from full-wave ambient noise tomography with resolvable depths down to 120 km. It is based on an empirical Green’s function data set extracted from cross-correlation between station pairs. The tomography method involves 3-D wave propagation simulation. The travel-time different between the synthetics and the observed empirical Green’s functions are inverted based on finite-frequency sensitivity kernels to get velocity perturbations. The velocity model is updated iteratively. |
| Authors: | |
| Xiaotao Yang | |
| Department of Geosciences | |
| University of Massachusetts Amherst | |
| 627 North Pleasant Street, Amherst, MA 01003 | |
| Haiying Gao | |
| Department of Geosciences | |
| University of Massachusetts Amherst | |
| 627 North Pleasant Street, Amherst, MA 01003 | |
| Previous Model | None |
| Reference Model | The reference velocity model consists of two parts: a global shear-velocity model for the top 70 km (Shapiro and Ritzwoller, 2002) and the North American upper mantle model at greater depths (Bedle and van der Lee, 2009). |
| Model Download | YangAndGao-NEUS-Vs2018.nc (see metadata ), is the netCDF file for the model |
| Model Homepage | |
| Depth Coverage | From 0 km to 120 km |
| Area | Northeastern United States (latitude: 38.5° to 47.5°, longitude: -76° to -67°) |
| Data Set Description | The data set includes the shear velocity model on an inversion grid of longitude and latitude with spacing of 0.015° in both directions. No smoothing or interpolation applied. Vertical grid spacing increases with depth. |
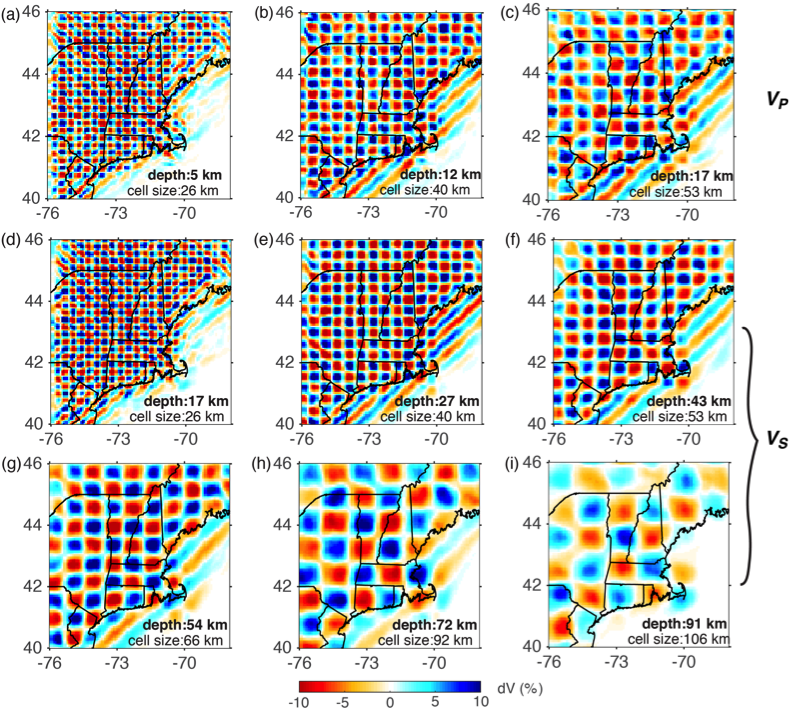
| Model Resolution | As tested and validated by previous applications of full-wave tomographic imaging (e.g., Gao, 2018; Zhang and Shen, 2008), Rayleigh waves are most sensitive to P-wave velocity at shallow depths (< 15 km) and to S-wave velocity at greater depths. Although P-wave velocity model is also provided for all depth, interpretation of P velocities deeper than 15 km and shallower than 5 km is discouraged. The model provided here is from the inversion result of the 6th iteration without smoothing or interpolation. When interpreting the velocity model, it is recommended that the user smooth the model based on the best resolution at the corresponding depth, as shown in Yang and Gao (2018) and in Figure 2 on this page. The checkerboard amplitude and pattern of P-wave velocity perturbations can be well recovered at depths of 5 km, 12 km, and 17 km with horizontal scales of approximately 26 km, 40 km, and 53 km, respectively. For the deeper crust and uppermost mantle, our checkerboard resolution tests can resolve shear velocity perturbations with horizontal scales ranging from 26 km (at 17 km depth) to 53 km (at 43 km depth). Within the mantle lithosphere, seismic features with horizontal scales of 60-100 km can be well resolved. |

model: NEUS-Vs2018 (after Yang and Gao, 2018).

within ±10% in the input models (after supplementary Figure S6 in Yang and Gao, 2018).
Citations and DOIs
To cite the original work behind this Earth model:
- Yang, X., H. Gao (2018). Full-Wave Seismic Tomography in the Northeastern United States: New Insights into the Uplift Mechanism of the Adirondack Mountains, Geophysical Research Letters, 45, https://doi.org/10.1029/2018GL078438
To cite IRIS DMC Data Products effort:
- Trabant, C., A. R. Hutko, M. Bahavar, R. Karstens, T. Ahern, and R. Aster (2012), Data Products at the IRIS DMC: Stepping Stones for Research and Other Applications, Seismological Research Letters, 83(5), 846–854, https://doi.org/10.1785/0220120032.
DOI for this EMC webpage:
References
- Bedle, H., and S. van der Lee (2009), S velocity variations beneath North America, J. Geophys. Res.-Sol. Ea., 114, https://doi.org/10.1029/2008jb005949
- Gao, H. Y. (2018), Three-dimensional variations of the slab geometry correlate with earthquake distributions at the Cascadia subduction system, Nat. Commun., 9, https://doi.org/10.1038/s41467-018-03655-5.
- Shapiro, N. M., and M. H. Ritzwoller (2002), Monte-Carlo inversion for a global shear-velocity model of the crust and upper mantle, Geophys. J. Int., 151(1), 88-105, https://doi.org/10.1046/j.1365-246X.2002.01742.x
- Zhang, Z., and Y. Shen (2008), Cross-dependence of finite-frequency compressional waveforms to shear seismic wave speeds, Geophys. J. Int., 174(3), 941-948, https://doi.org/10.1111/j.1365-246X.2008.03840.x.
Credits
Model contributed by Xiaotao Yang
Timeline
- 2018-07-03
- online


