Summary
This is a 3D velocity model of the North Island of New Zealand derived using earthquake-based adjoint tomography.
Quicklinks
Description
| Name | nz_atom_north_chow_etal_2021_vp+vs |
| Title | New Zealand Adjoint TOMography velocity model (North Island) |
| Type | 3-D Tomography Earth Model |
| Sub Type | Shear-wave velocity (km/s) and Compressional-wave velocity (km/s) |
| Year | 2021 |
| EMC Data Revision | r0.1 (revision history) |
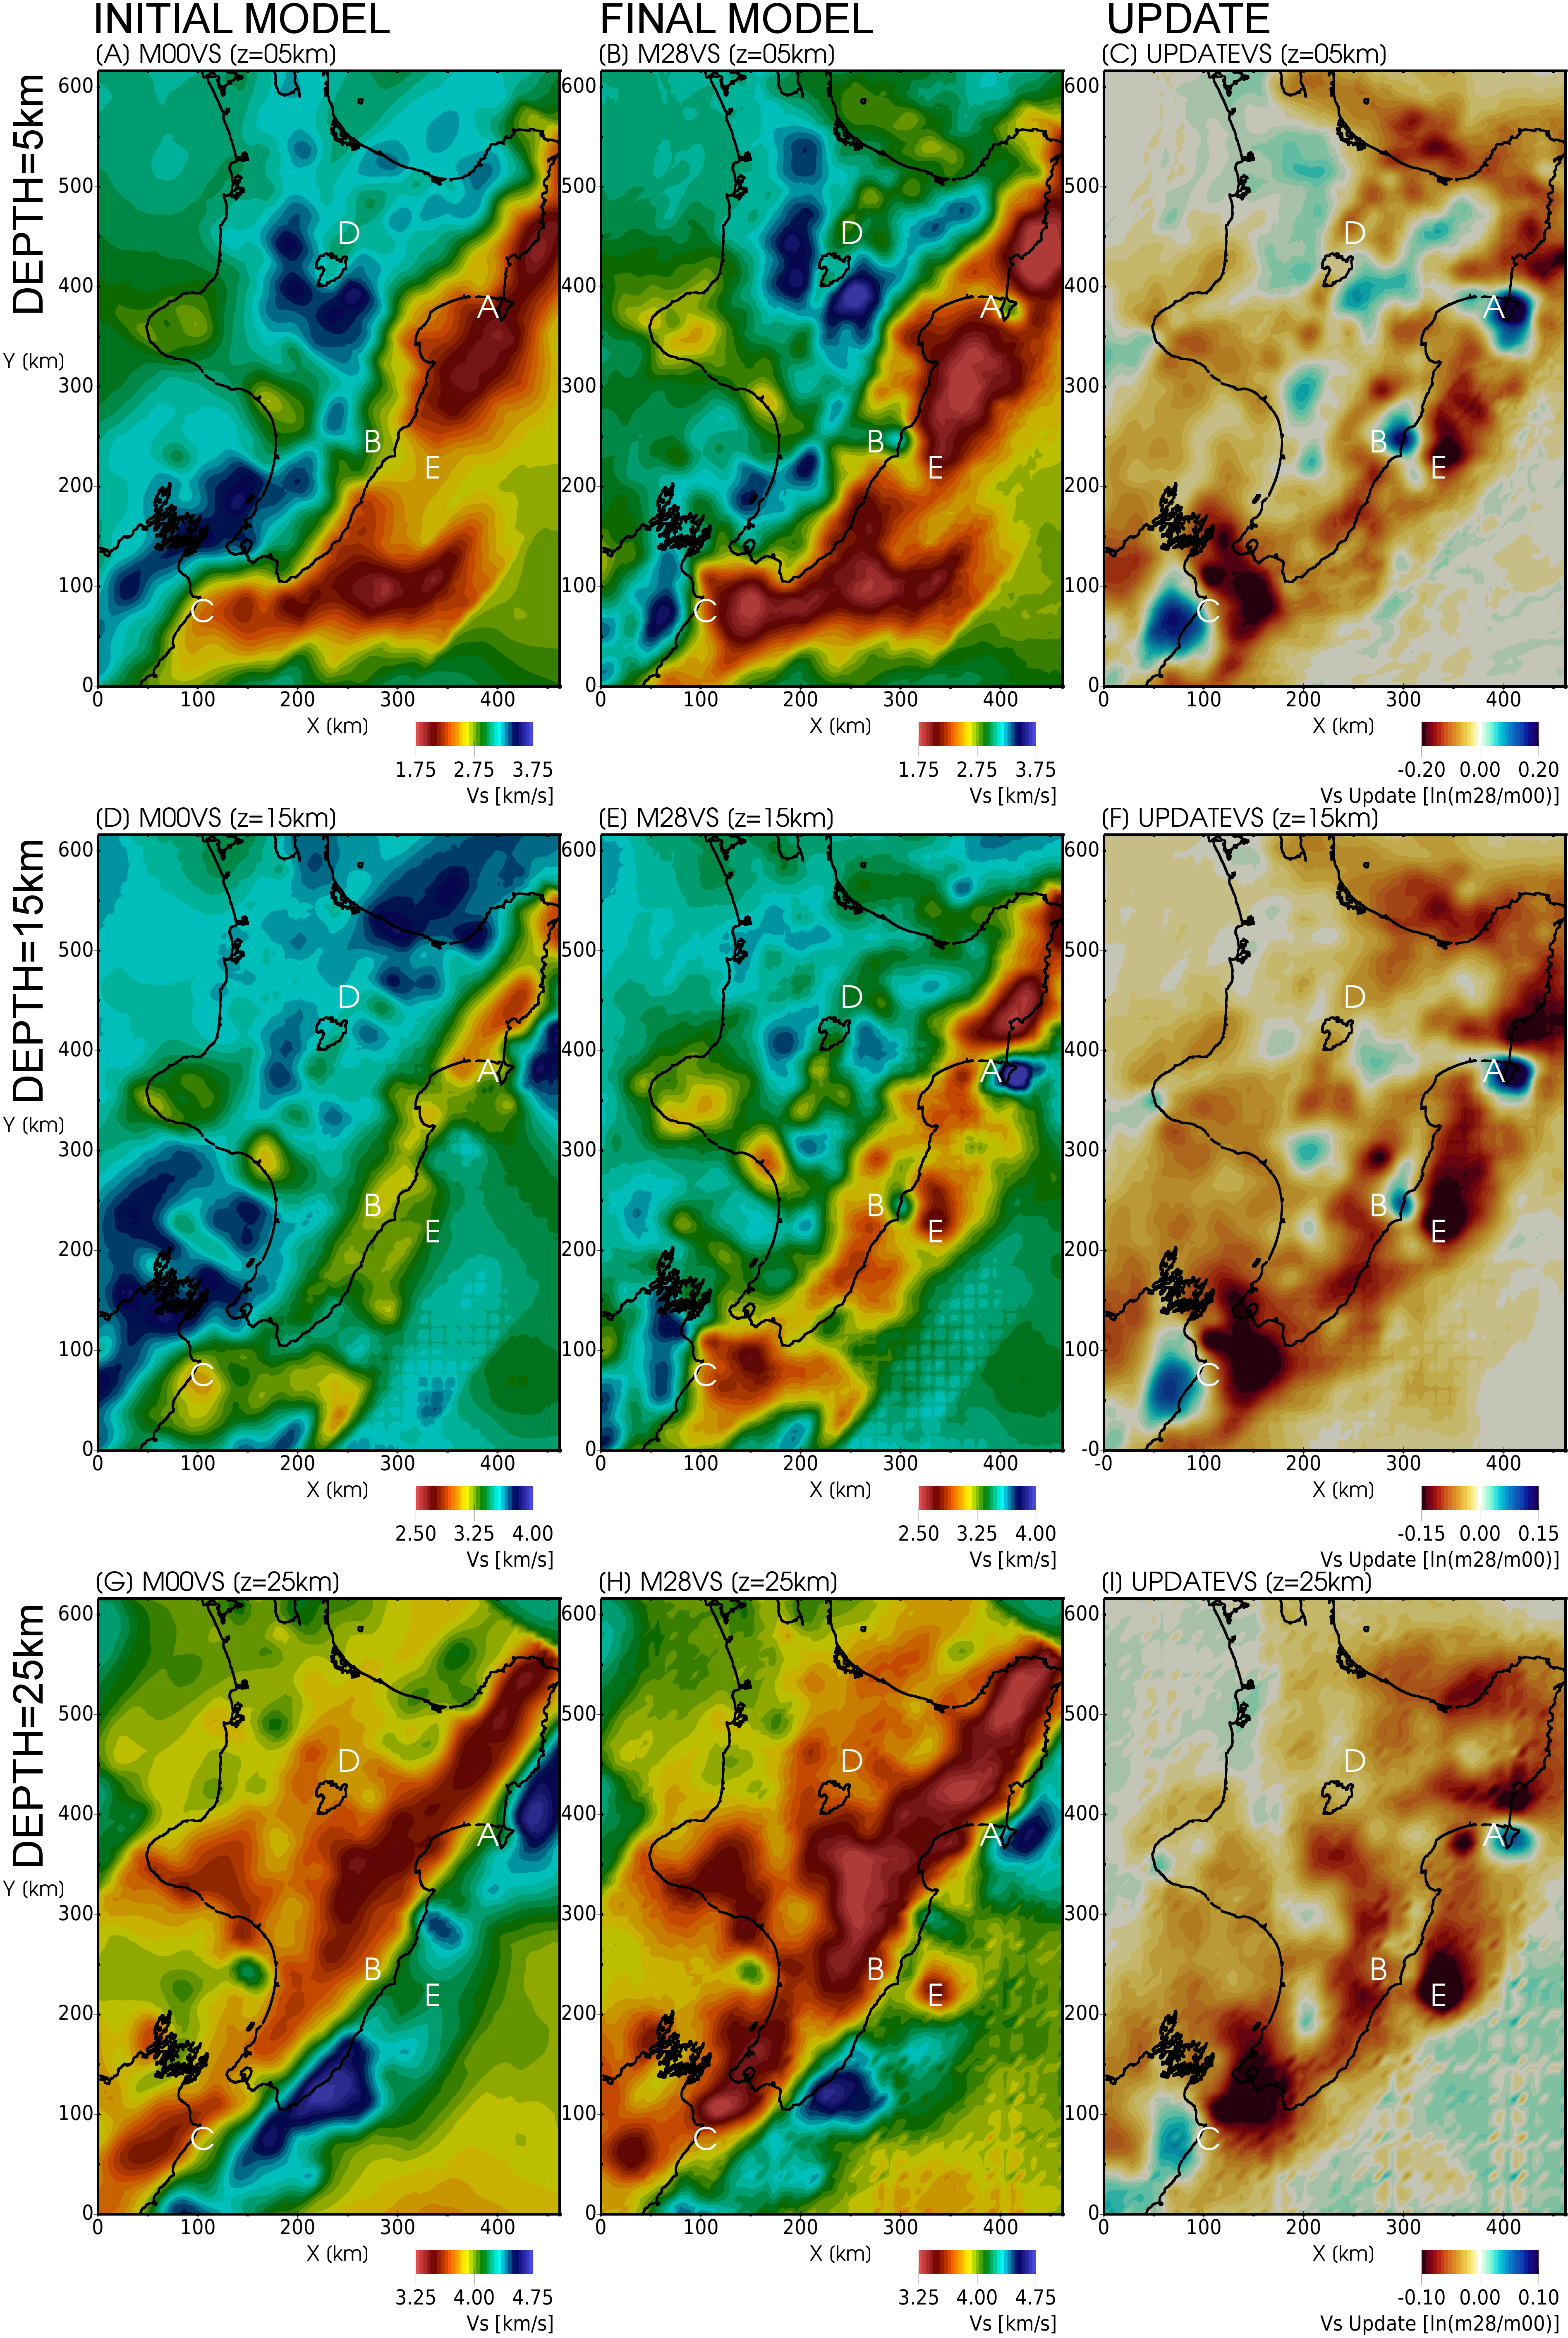
| Short Description | This is a 3D velocity model of the North Island of New Zealand derived using earthquake-based adjoint tomography. The starting model is defined as the ray-based NZ-Wide2.2 Velocity Model from Eberhart-Phillips et al. (2021). To derive this velocity model, we iteratively improve fits between earthquake observations from New Zealand-based broadband seismometers and synthetically generated waveforms from spectral element simulations. The waveform bandpass of interest is 4-30s. This velocity model defines the following quantities: Vp (km/s), Vs (km/s), density (kg/m3), Qp and Qs, however only Vp and Vs are updated during our inversion. The remaining quantities are defined by the starting velocity model. |
| Authors: | Bryant Chow, Victoria University of Wellington, Wellington, New Zealand GNS Science, Lower Hutt, New Zealand (Now at University of Alaska Fairbanks) Yoshihiro Kaneko, Department of Geophysics, Kyoto University, Kyoto, Japan Carl Tape, Geophysical Institute, University of Alaska Fairbanks, Fairbanks, AK, USA Ryan Modrak, Los Alamos National Laboratory, Los Alamos, NM, USA Nick Mortimer, GNS Science, Dunedin, New Zealand Stephen Bannister, GNS Science, Lower Hutt, New Zealand John Townend, Victoria University of Wellington, Wellington, New Zealand |
| Contact | Bryant Chow (bhchow@alaska.edu) |
| Previous Model | |
| Reference Model | NZ-Wide2.2 Velocity Model (Eberhart-Phillips et al.) Note: The provided reference model has been rotated and interpolated from its original format for use in our tomographic inversion. Additionally, this reference model encompasses a domain that is larger than the velocity model, but its values are only valid within the volume defined by the NZ ATOM North velocity model, stated explicitly in the Area section below. |
| Usage Notes | The geodetic datum of the original model is EPSG:32760 WGS 84/ UTM zone 60S. Two-dimensional latitude, longitude, coordinate variables in the netCDF 4 CLASSIC files for this model are expressed as a function of the UTM X and Y axis (see netCDF CF Metadata Conventions). |
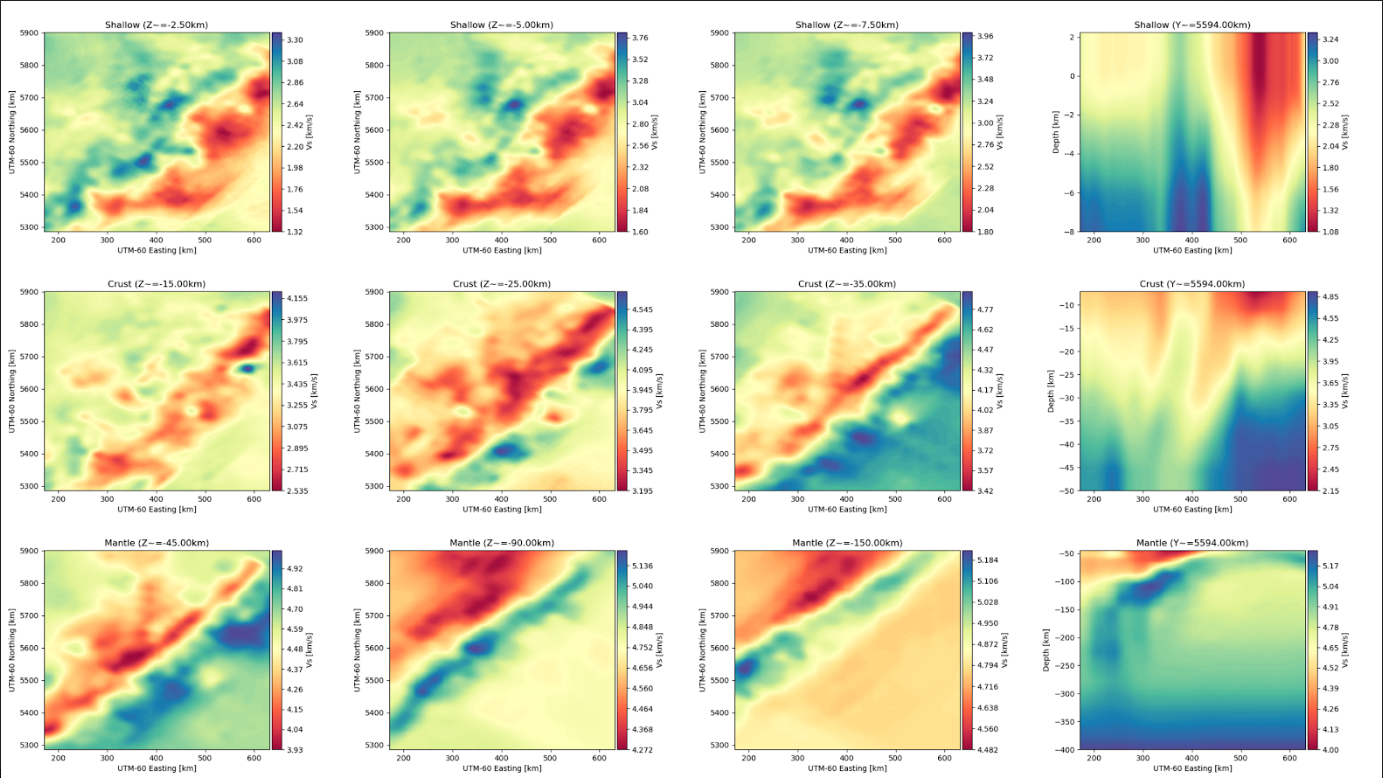
| Data Files Description | The velocity model is separated into three files covering overlapping depth ranges and with differing grid spacing:
|
| Revision Notes | Notes on NZATOM r0.1 Background The New Zealand Adjoint TOmography Model (NZATOM) is a 3D velocity model derived from a full waveform inversion using the numerical solver SPECFEM3D Cartesian (SPECFEM3D). SPECFEM3D is a spectral-element solver, which solves the seismic wave equation on unstructured hexahedral meshes (deformed cubes). These GLL (Gauss-Lobatto-Legendre) models stretch and skew cubic elements to conform to interface boundaries (e.g., topography, moho topography), or coarsening layers, where elements increase in vertical or lateral size. These coarsening layers are used to decrease element sizes at depth, where seismic wavespeeds typically increase, allowing for less computational requirements for the same numerical resolution. During the inversion procedure, two meshes with varying resolution were used in order to save computational expense. We call these two meshes coarse and fine. Both coarse and fine meshes had different element sizes and coarsening layer depths. Due to decreasing resolution with depth, the final NZATOM model published on IRIS EMC is split into three overlapping blocks: shallow (-3–8km), crust (7–50km), mantle (44–400km) Problem The original model shows obvious numerical artefacts due to the interpolation of an unregular mesh onto a regular grid at various stages of the inversion workflow. To obtain NZATOM in a file format usable by non-SPECFEM users, we needed to interpolate it onto a regular (XYZ) grid. The original method for doing so was to use a nearest-neighbor algorithm on the original NZATOM GLL mesh to determine model values for a given uniform grid based on the nearest GLL point available. That is, for a given point r(x,y,z) in our regular grid, the program would find the nearest GLL point and assign that to point r. This method worked nominally for regular elements, but for skewed elements related to coarsening layers the nearest neighbor algorithm tended to create artefacts as certain points r began to show outlines of element boundaries as they passed through skewed elements. During the inversion, this approach was also used to transfer our tomography model from the coarse to the fine mesh. Therefore the coarsening layers of the coarse mesh were imparted onto the fine mesh. Similarly, extracting the final velocity model imparted the coarsening layers of the fine mesh onto the published version of NZATOM. 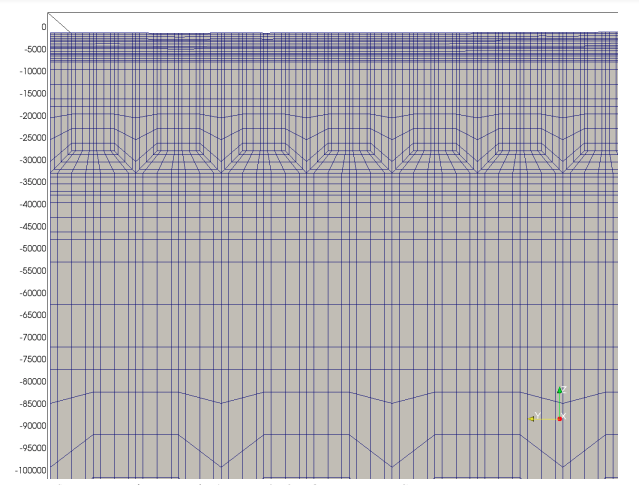 at approximately 25km and 90km depths. These coarsening layers lead to artefacts from nearest-neighbor interpolation of the original NZATOM model. Depths are shown in units of meters. Artefacts correspond to the coarsening layers of both the coarse and fine mesh:
We interpolate affected model onto a regular mesh, smooth away artefacts, and re-extract onto regular grid. To remove these artefacts from the underlying model, while avoiding adding any new additional artefacts, our approach was to start from a regularized GLL grid. That is, a GLL mesh with no topography, bathymetry, or coarsening layers, that shares an origin and domain with the original NZATOM GLL mesh. We then take the NZATOM model present on IRIS EMC, in a regularized XYZ format and containing artefacts from the nearest neighbor approach, and interpolate this onto our new regularized mesh. The result is now a regular (cube-shaped elements) GLL mesh that has model values corresponding to the NZATOM model, and contains numerical artefacts. We then apply a 2D Gaussian smoothing to the entire model. Smoothing coefficients for each smoothed model are provided in the following subsection. Smoothing coefficient values were determined through trial-and-error and visual inspection of the smoothed model, to determine if artefacts were sufficiently, without removing real small-scale features in the models. The smoothing procedure resulted in significant removal of the numerical artefacts, while perserving small-scale heterogeneities (~5km width). Although some artefacts can still be seen in the resulting model, they should not have significant affect on future applications of the model. Workflow
Shallow model (-2.25–8km depth):
The revised model was again derived by taking nearest-neighbor interpolation on a regular grid for each of the sub-models. Now that the underlying GLL model is regular, there are no artefacts that arise from this approach and the resulting XYZ models show smoothly varying values and no artefacting. 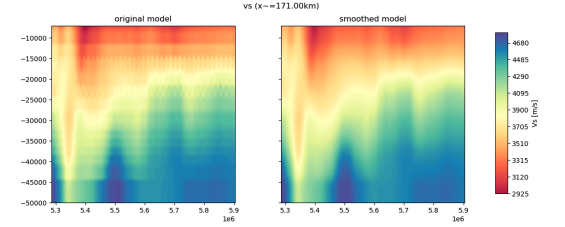 Left: Original NZATOM model showing visible artefacts. Right: Revised (r0.1) NZATOM model smoothed with a 2D Gaussian w/ a horizontal half-width of 3km, and a vertical half-width of 1km 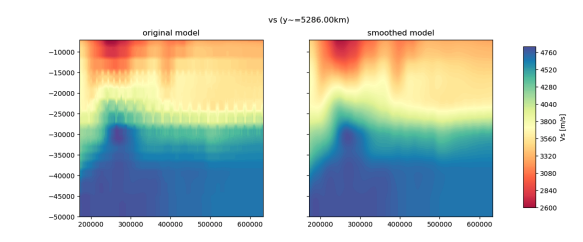 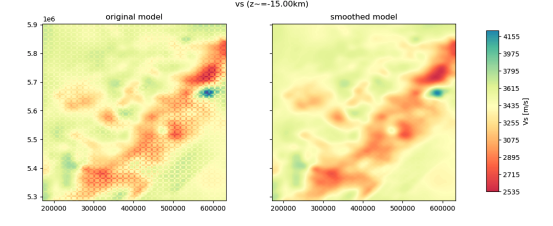 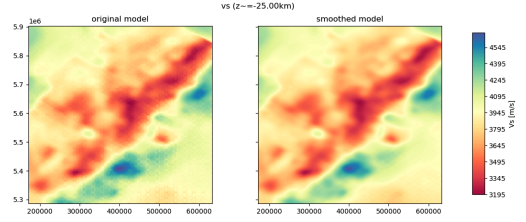 The smoothing procedure will have damped the largest amplitudes of the underlying model, resulting in slightly lower minimum and maximum amplitudes for all parameters. Domain Bounds Due to a new approach in interpolating the underlying model, the published revision has slightly different domain bounds as the original model (smaller). The grid spacing is kept the same as the original model. Topography The topography on the original NZATOM GLL model was defined by SRTM-30P, with no model values given for values in the air (above topography). Because the regular model published to IRIS EMC was given as a regular cube, values in the air were extrapolated from the nearest point in the model. This newly revised model does the same, so Users are cautioned when querying model parameters above topography/bathymetry depth values. |
| Model Download | Please see the above Data Files Description and Usage Notes sections about these files. Model files in netCDF 4 Classic format:
|
| Depth Coverage | -2.25 to 400.0 km (below earth surface) |
| Area | North Island of New Zealand and the Hikurangi subduction zone Coordinate system: UTM 60S x-axis 17100,63100, y-axis 5286000, 5902000 Coordinate system: WGS84 latitude -42.6°, -36.9°, longitude 173.0°, 178.5° |
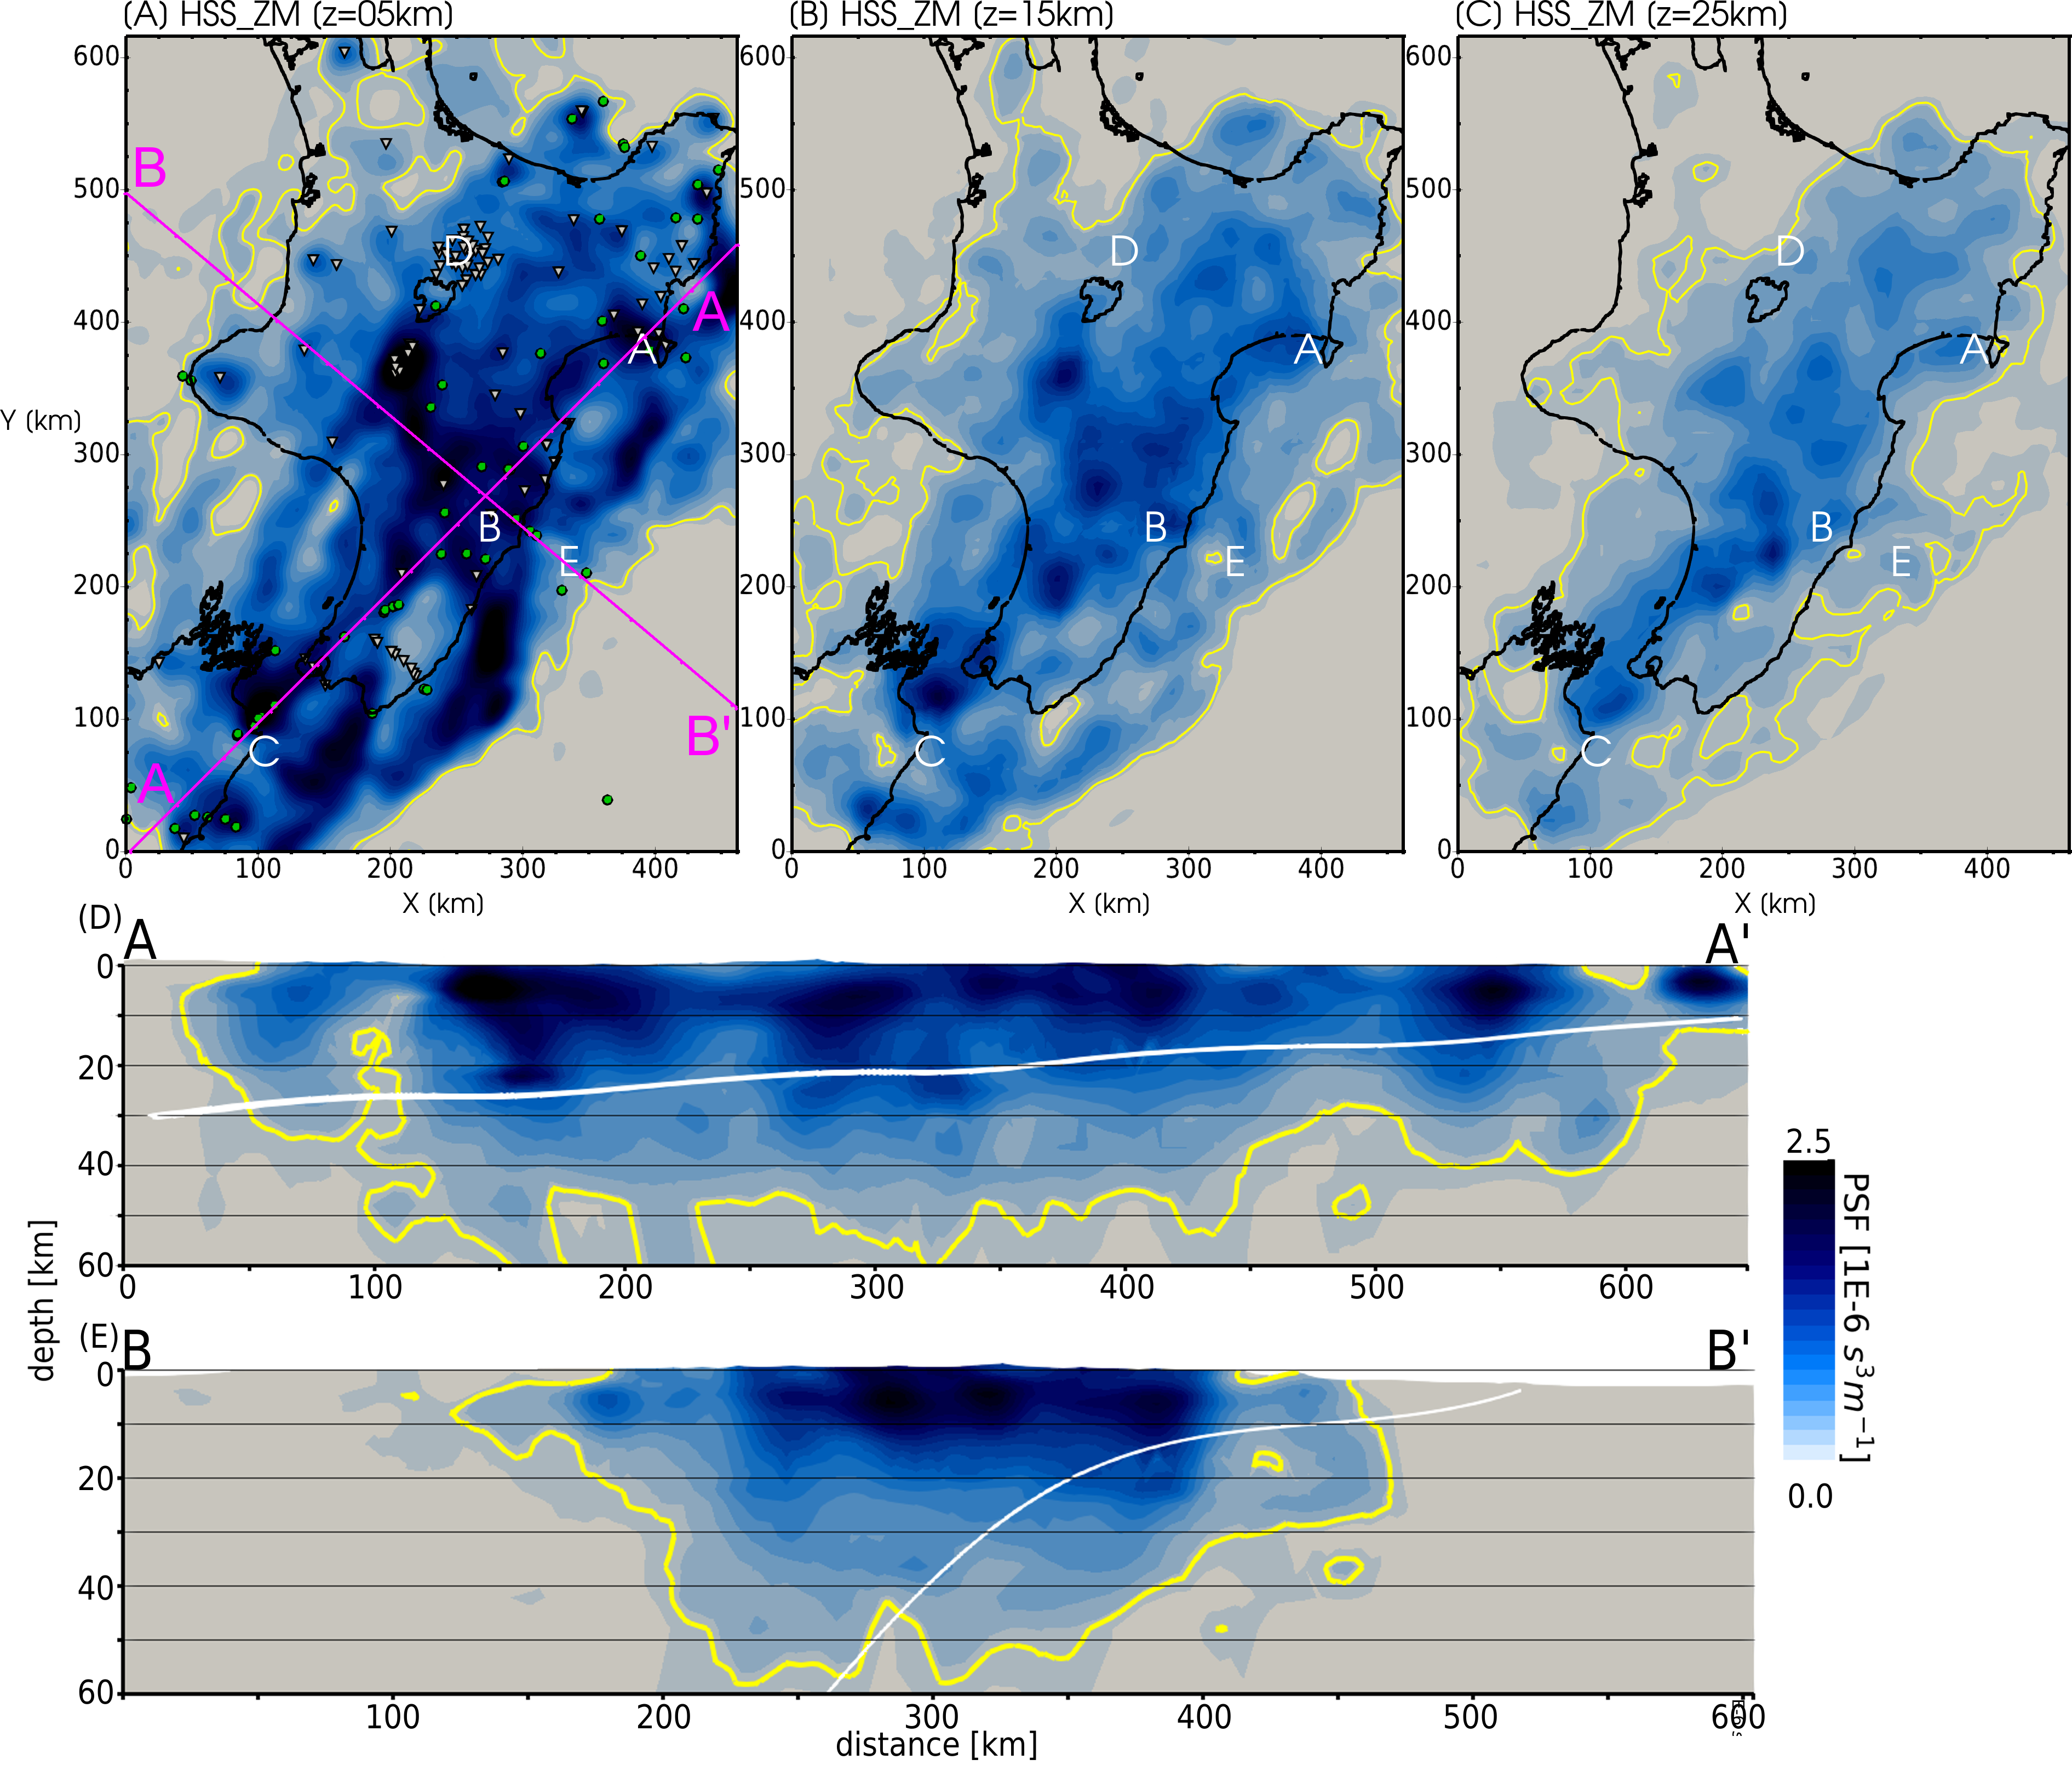
| Data Set Description | Dataset includes seismic waveforms filtered at 4-30s period. Waveforms from 60 earthquakes recorded on up to 88 broadboad three-component seisimic stations, resulting in 1800 unique source-receiver pairs. Broadband stations include the following networks: |
Citations and DOIs
To cite the original work behind this Earth model:
- Chow, Bryant, Yoshihiro Kaneko, Carl Tape, Ryan Modrak, Nick Mortimer, Stephen Bannister, and John Townend. “Strong upper-plate heterogeneity at the Hikurangi subduction margin (North Island, New Zealand) imaged by adjoint tomography.” Journal of Geophysical Research: Solid Earth, accepted Dec. 9, 2021, https://doi.org/10.1029/2021JB022865
To cite IRIS DMC Data Products effort:
- Trabant, C., A. R. Hutko, M. Bahavar, R. Karstens, T. Ahern, and R. Aster (2012), Data Products at the IRIS DMC: Stepping Stones for Research and Other Applications, Seismological Research Letters, 83(5), 846–854, https://doi.org/10.1785/0220120032.
DOI for this EMC webpage: https://doi.org/10.17611/dp/emc.2021.nzatomnnorthvpvs.1
References
- Chow, Bryant, Yoshihiro Kaneko, and John Townend. “Evidence for deeply-subducted lower-plate seamounts at the Hikurangi subduction margin: implications for seismic and aseismic behavior.” Journal of Geophysical Research: Solid Earth, accepted Dec. 28, 2021, https://doi.org/10.1029/2021JB022866
- Chow, Bryant, Yoshihiro Kaneko, Carl Tape, Ryan Modrak, and John Townend. “An automated workflow for adjoint tomography—waveform misfits and synthetic inversions for the North Island, New Zealand.” Geophysical Journal International 223, no. 3 (2020): 1461-1480. https://doi.org/10.1093/gji/ggaa381
- Eberhart-Phillips, Donna, Bannister, Stephen, Reyners, Martin, & Henrys, Stuart. (2020). New Zealand Wide model 2.2 seismic velocity and Qs and Qp models for New Zealand [Data set]. Zenodo. https://doi.org/10.5281/zenodo.3779523
- Charles A. Williams, Donna Eberhart‐Phillips, Stephen Bannister, Daniel H. N. Barker, Stuart Henrys, Martin Reyners, Rupert Sutherland; Revised Interface Geometry for the Hikurangi Subduction Zone, New Zealand. Seismological Research Letters 2013; 84 (6): 1066–1073. https://doi.org/10.1785/0220130035
Credits
- Model provided by Bryant Chow
Revision History
revision r0.1: uploaded June 8, 2023.
revision r0.0: uploaded December 17, 2021.
Timeline
- 2022-02-03
- r0.0 online
- 2023-06-08
- r0.1 online


