Summary
The model Moho depth values for the entire central United States are based on common conversion point (CCP) stacking of teleseismic P-wave receiver functions calculated from data recorded by USArray stations and other permanent deployments in the central United States. In the OIINK network footprint, there is a refined Moho depth model using the OIINK Flexible Array stations and other regional stations.
Quicklinks
Description
| Name | OIINK_CUS_Moho2017 |
| Title | Moho depth and crystalline crustal thickness values within the central United States derived from receiver function observations |
| Type | Crustal thicknesses |
| Sub Type | depth and thickness in km |
| Year | 2017 |
| Short Description | The model Moho depth values for the entire central United States are based on common conversion point (CCP) stacking of teleseismic P-wave receiver functions calculated from data recorded by USArray stations and other permanent deployments in the central United States. In the OIINK network footprint, there is a refined Moho depth model using the OIINK Flexible Array stations and other regional stations. |
| Authors: | |
| Xiaotao Yang | |
| Department of Geosciences, University of Massachusetts | |
| 233 Morrill Science Center | |
| 627 North Pleasant Street | |
| Amherst, MA 01003, USA | |
| email: xiaotaoyang@umass.edu | |
| Previous Model | NA |
| Reference Model | NA |
| Model Download | The picked Moho surface depth and thickness of the crystalline crust from CUS CCP results: CUS_Moho_2017.nc (see metadata ), is the netCDF file for the model The original files in text format(CUS_crystallinecrust_thickness.txt & CUS_Moho.txt The picked Moho surface depth and thickness of the crystalline crust from OIINK CCP results: OIINK_Moho_2017.nc (see metadata ), is the netCDF file for the model The original files in text format(OIINK_crystallinecrust_thickness.txt & OIINK_Moho.txt |
| Original Model Repository | http://onlinelibrary.wiley.com/doi/10.1002/2017JB014150/epdf |
| Depth Coverage | |
| Area | Central United States (latitude: 33°/43°; longitude: -96°/-80.8°) |
| Data Set Description | This model includes Moho depths in two scales: the entire Central United States (CUS) and the footprint of the OIINK network. The Moho depths are extracted from the image volumes of P-to-S receiver functions using 3-D common conversion point (CCP) stacking for the CUS region, and the advanced Plane-Wave Migration (PWMIG) for the OIINK area within the broader CUS region. 291,020 and 179,244 receiver functions in the central United States are used in generating the images for the CUS area and the OIINK area, respectively. The crystalline crustal thickness values are derived by subtracting the top Phanerozoic sedimentary layers from the Moho depth (see Yang et al., 2017 for details). The CUS Moho depths range from 33.7 km to 66.9 km and the OIINK Moho depths range from 41 km to 65.4 km. The crystalline crustal thickness ranges from 32.5 km to 61.4 km in the CUS area and from 36.6 km to 63.5 km in the OIINK footprint region. Animations of the image volumes with the extracted Moho are available as supplements for Yang et al. [2017]. |
| Supplemental Information | |

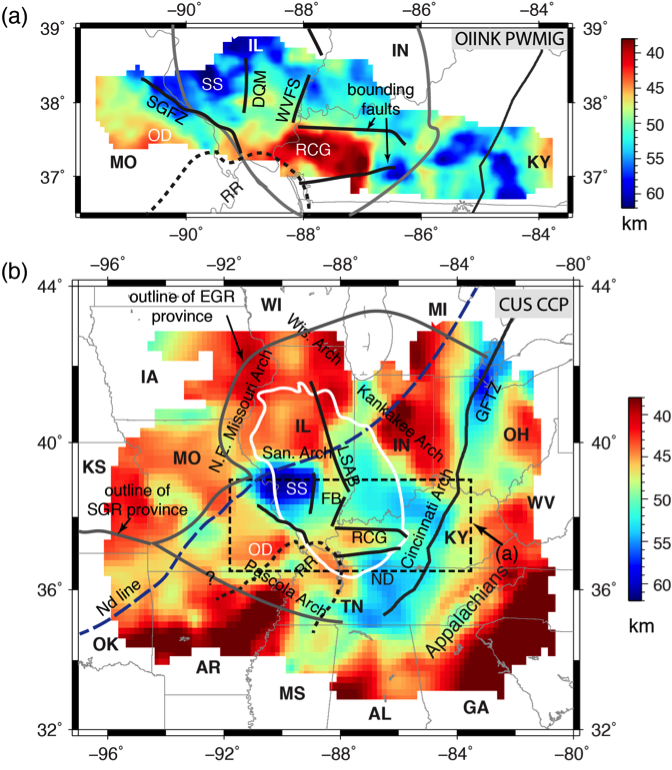
showing the strongly varied crustal thicknesses in the south-central Illinois Basin region.
(a) Plane-Wave Migration result using OIINK P-wave receiver functions. (b) Common Conversion Point
stacking result using P-wave receiver functions recorded by other regional networks. See Figure 2 in
the main text for names (abbreviations) and locations of major structures.
Citations and DOIs
To cite the original work behind this Earth model:
- Yang, X., G. L. Pavlis, M. W. Hamburger, S. Marshak, H. Gilbert, J. Rupp, T. H., Larson, C. Chen, and N. S. Carpenter (2017), Detailed crustal thickness variations beneath the Illinois Basin area: Implications for crustal evolution of the midcontinent, J. Geophys. Res. Solid Earth, 122, 6323–6345, https://doi.org/10.1002/2017JB014150.
To cite IRIS DMC Data Products effort:
- Trabant, C., A. R. Hutko, M. Bahavar, R. Karstens, T. Ahern, and R. Aster (2012), Data Products at the IRIS DMC: Stepping Stones for Research and Other Applications, Seismological Research Letters, 83(5), 846–854, https://doi.org/10.1785/0220120032.
DOI for this EMC webpage:
Credits
Model provided by Xiaotao Yang
Timeline
- 2017-12-20
- online


