Summary
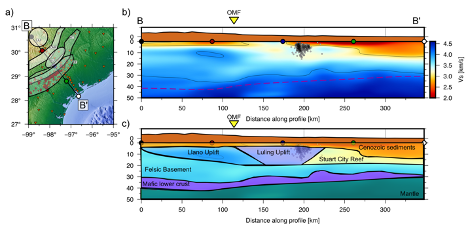
TX_EF_2020-S is a S-velocity model of the Eagle Ford of southeastern Texas from joint inversion of Ambient Noise Tomography and P to S Receiver Functions.
Quicklinks
Description
| Name | TX_EF_2020-S | ||
| Title | S-velocity model of the Eagle Ford of southeastern Texas from joint inversion of Ambient Noise Tomography and P to S Receiver Functions | ||
| Type | 3-D Tomography Earth Model | ||
| Sub Type | S velocity perturbation (%) and S velocity (km/s) | ||
| Year | 2020 | ||
| Short Description | TX_EF_2020-S provides estimates of shear velocity for southeastern Texas focused on the Eagle Ford Shale Play. The model uses passive source methods of ambient noise tomography and P to S receiver functions to jointly invert for shear velocity structure. The data is derived from recent TexNet broadband seismic deployments designed for earthquake monitoring and structural characterization. |
||
| Authors: | |||
| Robert W. Porritt University of Texas, Institute for Geophysics Jackson School of Geosciences University of Texas at Austin Austin, TX, USA |
|||
| Alexandros Savvaidis Bureau of Economic Geology Jackson School of Geosciences University of Texas at Austin Austin, TX, USA |
|||
| Bissett Young Bureau of Economic Geology Jackson School of Geosciences University of Texas at Austin Austin, TX, USA |
|||
| Matthew Shirley Bureau of Economic Geology Jackson School of Geosciences University of Texas at Austin Austin, TX, USA |
|||
| Peng Li Bureau of Economic Geology Jackson School of Geosciences University of Texas at Austin Austin, TX, USA |
|||
| Previous Model | N/A | ||
| Reference Model | N/A | ||
| Model Homepage | https://robporritt.wordpress.com/eagle-ford-structure/ | ||
| Model Download | Public link to the model bundle TX-EF-2020-S.nc (see metadata), is the netCDF file for the model |
||
| Model Homepage | None | ||
| Depth Coverage | 0 to 100 km | ||
| Area | Eagle Ford of southeastern Texas, Longitude: 99˚W to 95˚W in 0.05˚ increments, Latitude: 27˚N to 31˚N in 0.05˚ increments (map) | ||
| Data Set Description | Seismic data was obtained from IRIS for network codes: 2T [Part of TexNet; doi:10.7914/SN/TX], 4F [North Texas Earthquake Study: Venus (Johnson County), TX; doi:10.7914/SN/4F_2015], IU [Global Seismograph Network – IRIS/USGS; doi:10.7914/SN/IU], N4 [Central and Eastern US Network; doi:10.7914/SN/N4], SS [station DAL, no doi], TA [USArray Transportable Array; doi:10.7914/SN/TA], TX [TexNet; doi:10.7914/SN/TA], US [United States National Seismic Network; doi:10.7914/SN/US], X4 [Gulf of Mexico Basin Opening; no doi], X9 [Dallas Earthquake Swarm; doi:10.7914/SN/X9_2008], and ZW [North Texas Earthquake Study: Azle and Irving/Dallas; doi:10.7914/SN/ZW_2013]. | ||
| Model Resolution | The models have 1.2-km node spacing in all directions. Unmasked regions correspond to strong semblance (recovery of checkerboard patterns) for features of 20-km width. Depth resolution is generally best from the surface to 20 km depth. |

Citations and DOIs
To cite the original work behind this Earth model:
- Porritt, R. W., A. Savvaidis, B. Young, M. Shirley, and P. Li (2020), Crustal Structure in Southeastern Texas from Joint Inversion of Ambient Seismic Noise and P to S Receiver Functions, Geochemistry, Geophysics, Geosystems, https://doi.org/10.1029/2019GC008866.
To cite IRIS DMC Data Products effort:
- Trabant, C., A. R. Hutko, M. Bahavar, R. Karstens, T. Ahern, and R. Aster (2012), Data Products at the IRIS DMC: Stepping Stones for Research and Other Applications, Seismological Research Letters, 83(5), 846–854, https://doi.org/10.1785/0220120032.
DOI for this EMC webpage:
Credits
Model provided by Robert Porritt
Timeline
- 2020-05-08
- online


