


Summary
Deployment of Ocean-Bottom Seismometer (OBS) stations that are equipped with hydrophones provide an excellent opportunity to correlate microseism noise with changes in water pressure and ocean wave activities. This microseism energy quick look (MEQL) highlight provides a sample of such comparison utilizing seismic and hydroacoustic data from the 7D – Cascadia Initiative Community Experiment-OBS component and OO – Ocean Observatories Initiative OBS networks as well as standard meteorological data from the National Data Buoy Center. With this MEQL highlight, we welcome uggestions for a data product using OBS data.
Quicklinks
Description
Objective
The Secondary microseisms (SM) with periods between 3 and 10s are thought to be induced by pressure perturbations on the ocean bottom (Longuet-Higgins, 1950). The seismic and hydroacoustic waveform data from ocean-bottom seismometer (OBS) stations along with the meteorological data, collected by the buoy network of the National Data Buoy Center (NDBC), provide excellent microseism research opportunities. This MEQL highlight is an attempt by the IRIS DMC Data Products Team to gauge community interest in a potential new IRIS DMC data product that could be developed to serve the research community. Please send your comments or suggestions to the author (see Contact at the bottom of the page) regarding usefulness of this or similar OBS data processing as a new IRIS DMC Data Product. You may also use our online form to send us your suggestion for a new data product.
Data
In this highlight seismic and hydroacoustic data of selected stations from the following OBS networks are used. Data from these networks span from late 2011 to present through several deployment cycles:

The stations highlighted form two western and eastern clusters that are close to NDBC buoys 46005 and 46089, respectively, that provide meteorological data. Depending on the deployment period, each OBS station provides seismic and hydroacoustic data for January and February of 2012, 2013, 2014 or 2015 as shown in table below:
| Cluster | Network | Station | Year | Depth (m) | Channels |
|---|---|---|---|---|---|
| West | 7D | J39A | 2012 | 2659 | LHZ, BDH |
| East | 7D | J43A | 2012 | 2654 | BHZ, BDH |
| West | 7D | J48B | 2013 | 2877 | LHZ, LDH |
| East | 7D | J27B | 2013 | 2824 | LHZ, LDH |
| West | 7D | J32C | 2014 | 2756 | LHZ, LDH |
| East | 7D | J43C | 2014 | 2645 | LHZ, LDH |
| West | OO | AXBA1 | 2015 | 2607 | LHZ, LDH |
| East | OO | HYS14 | 2015 | 785 | LHZ, LDH |
| West | NDBC | 46005 | 2012 & 2015 | sea level | SWH |
| East | NDBC | 46089 | 2012-2015 | sea level | SWH |
Processing
The IRIS DMC Noise Toolkit is used to compute the integrated microseism power of the vertical component of seismic channels between 0.1 to 0.35 Hz using 1.5 hour windows with 50% overlap. A smoothing moving window of 6 hours is applied.
Hydroacoustic data are filtered using the same 0.1-0.35 Hz band. Traces from NDBC buoys show unfiltered significant wave height, the average of the highest one-third of all of the wave heights during the 20-minute sampling period.
Results & Observations
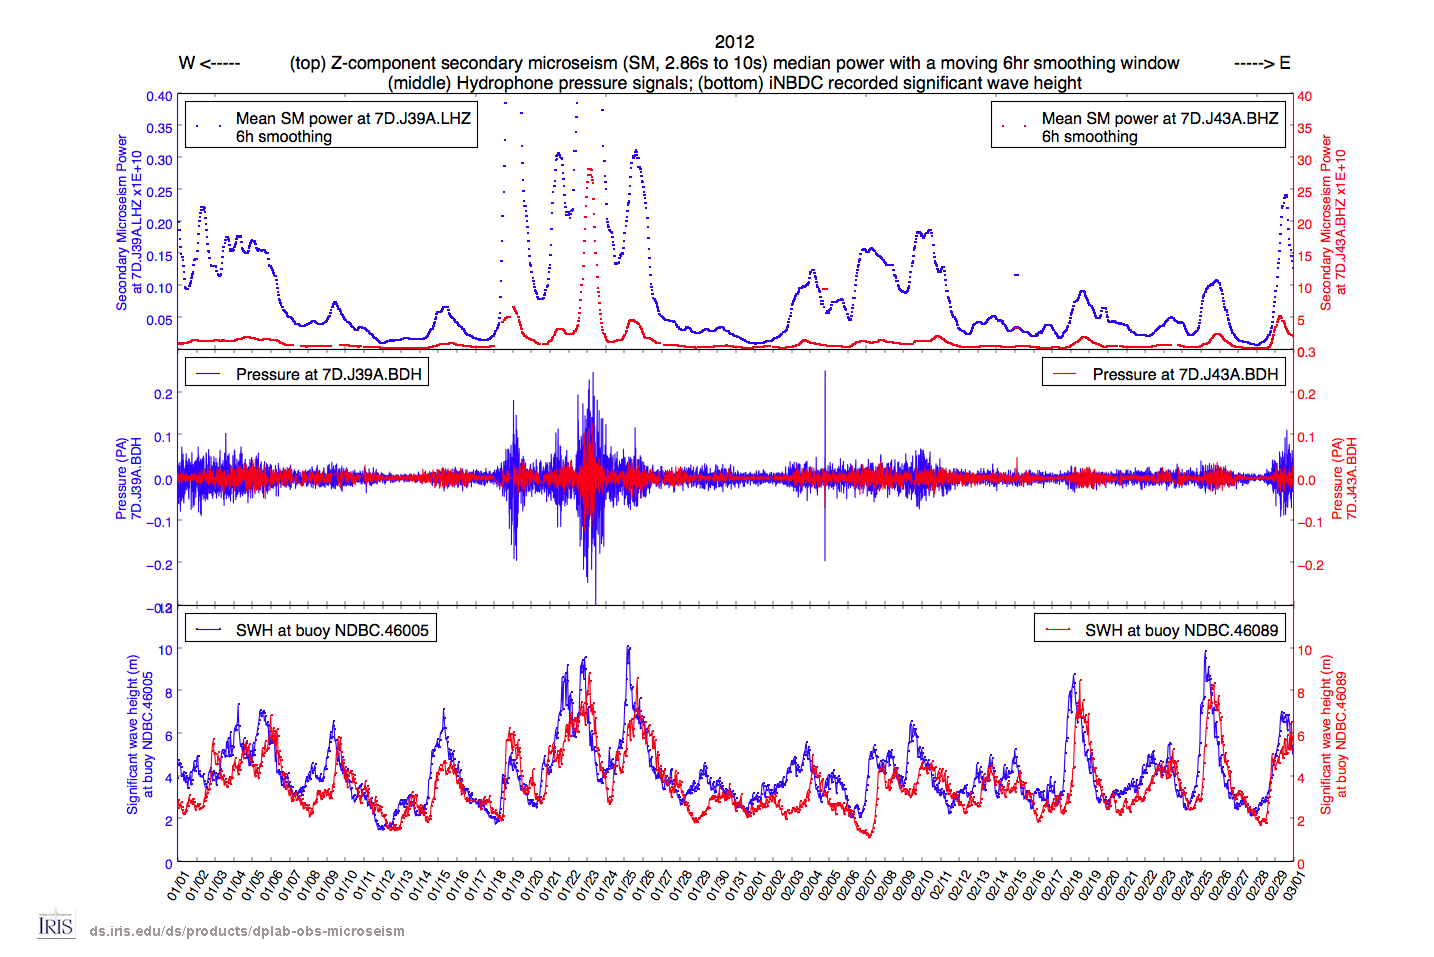
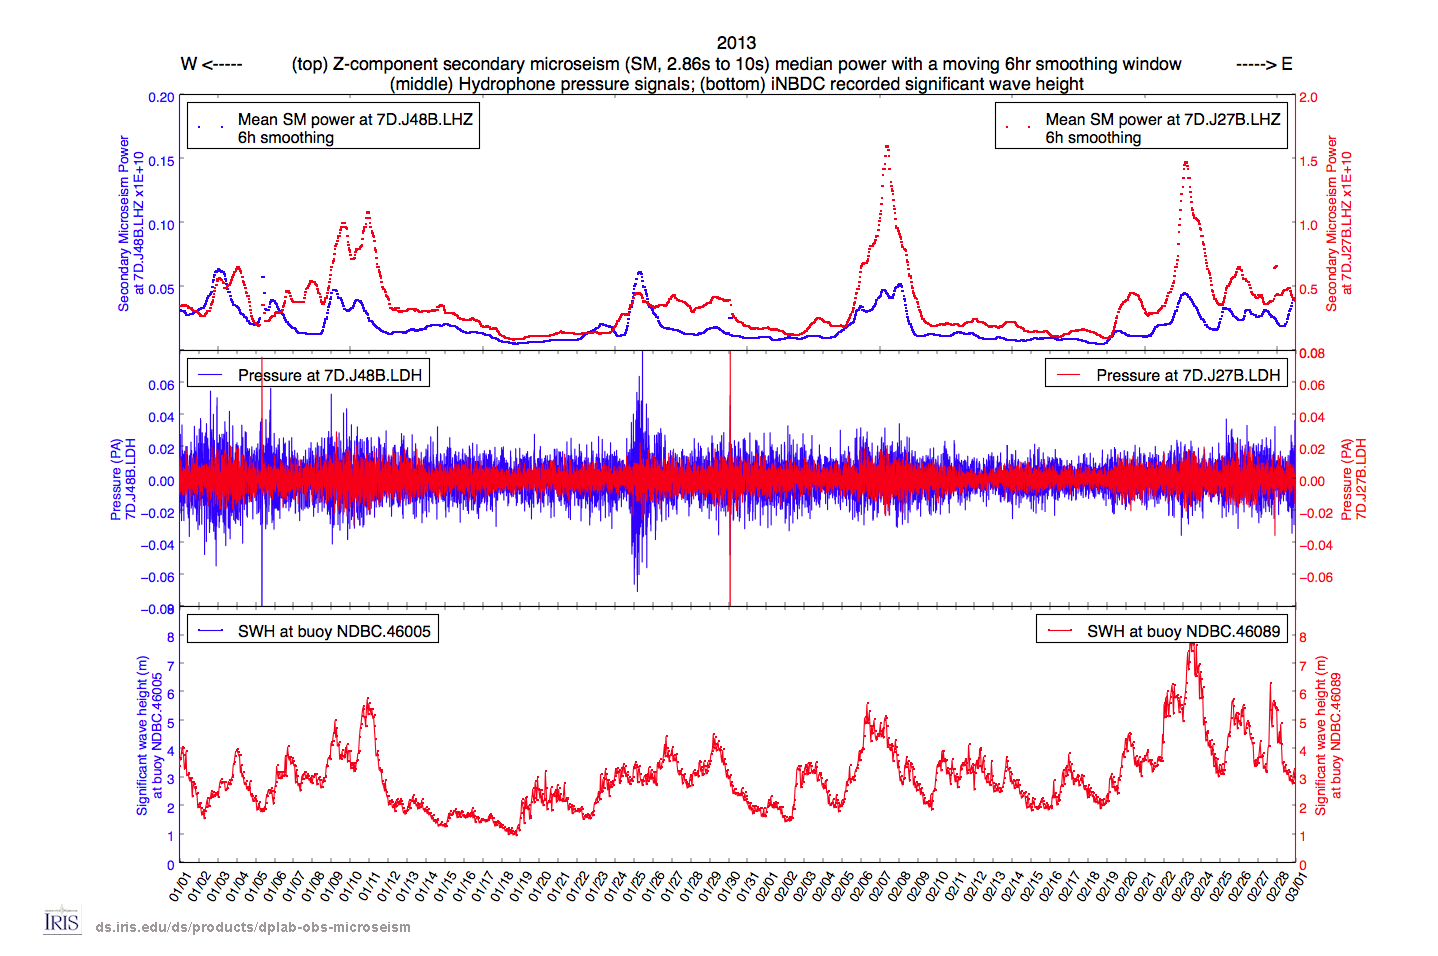
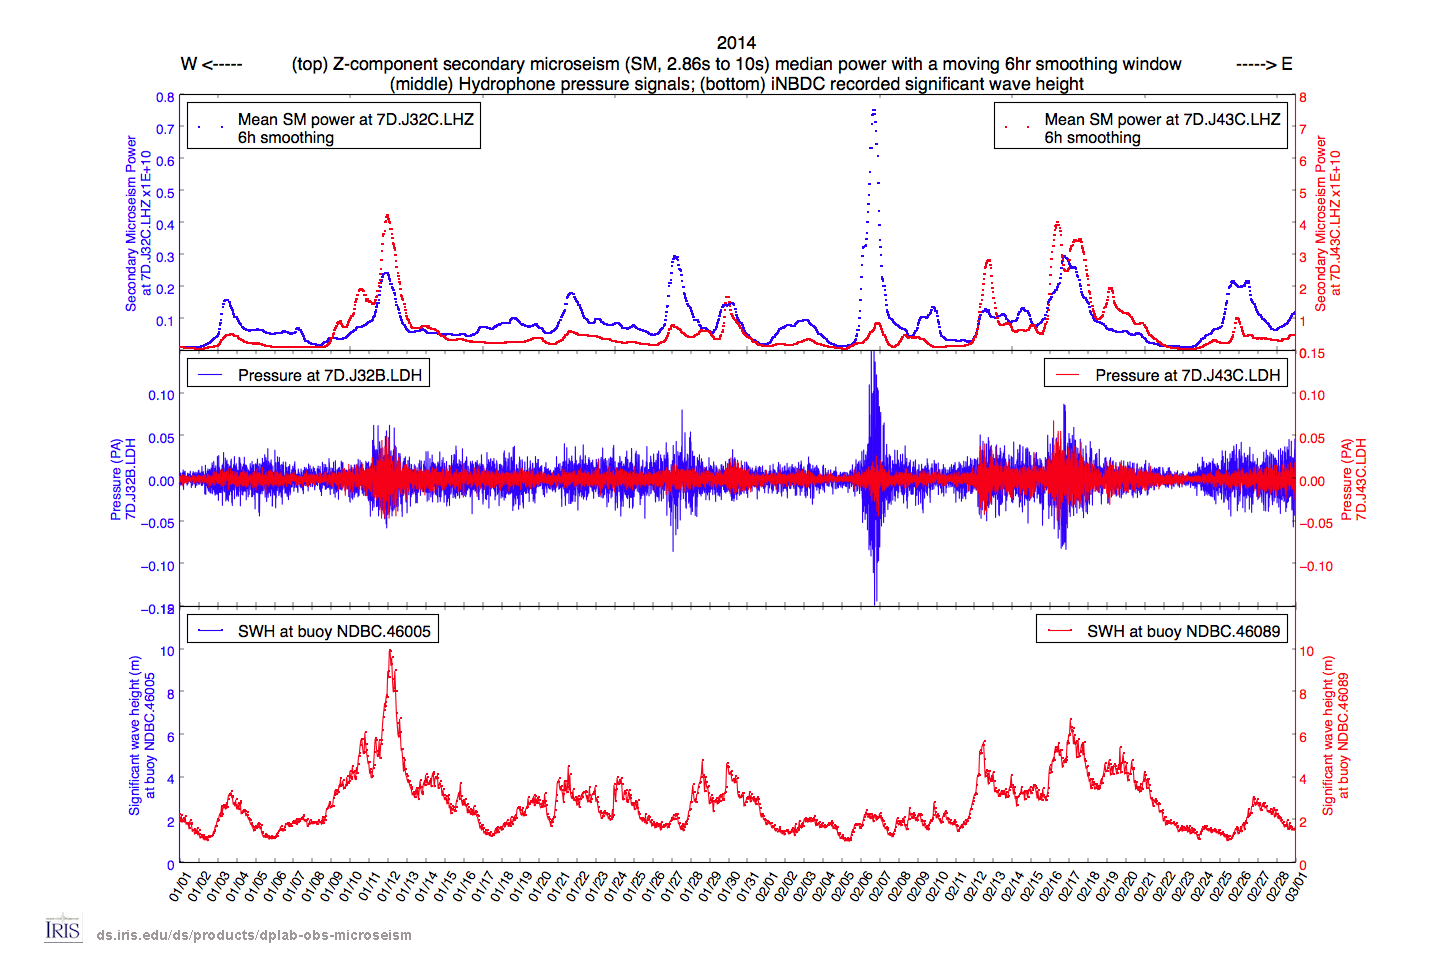
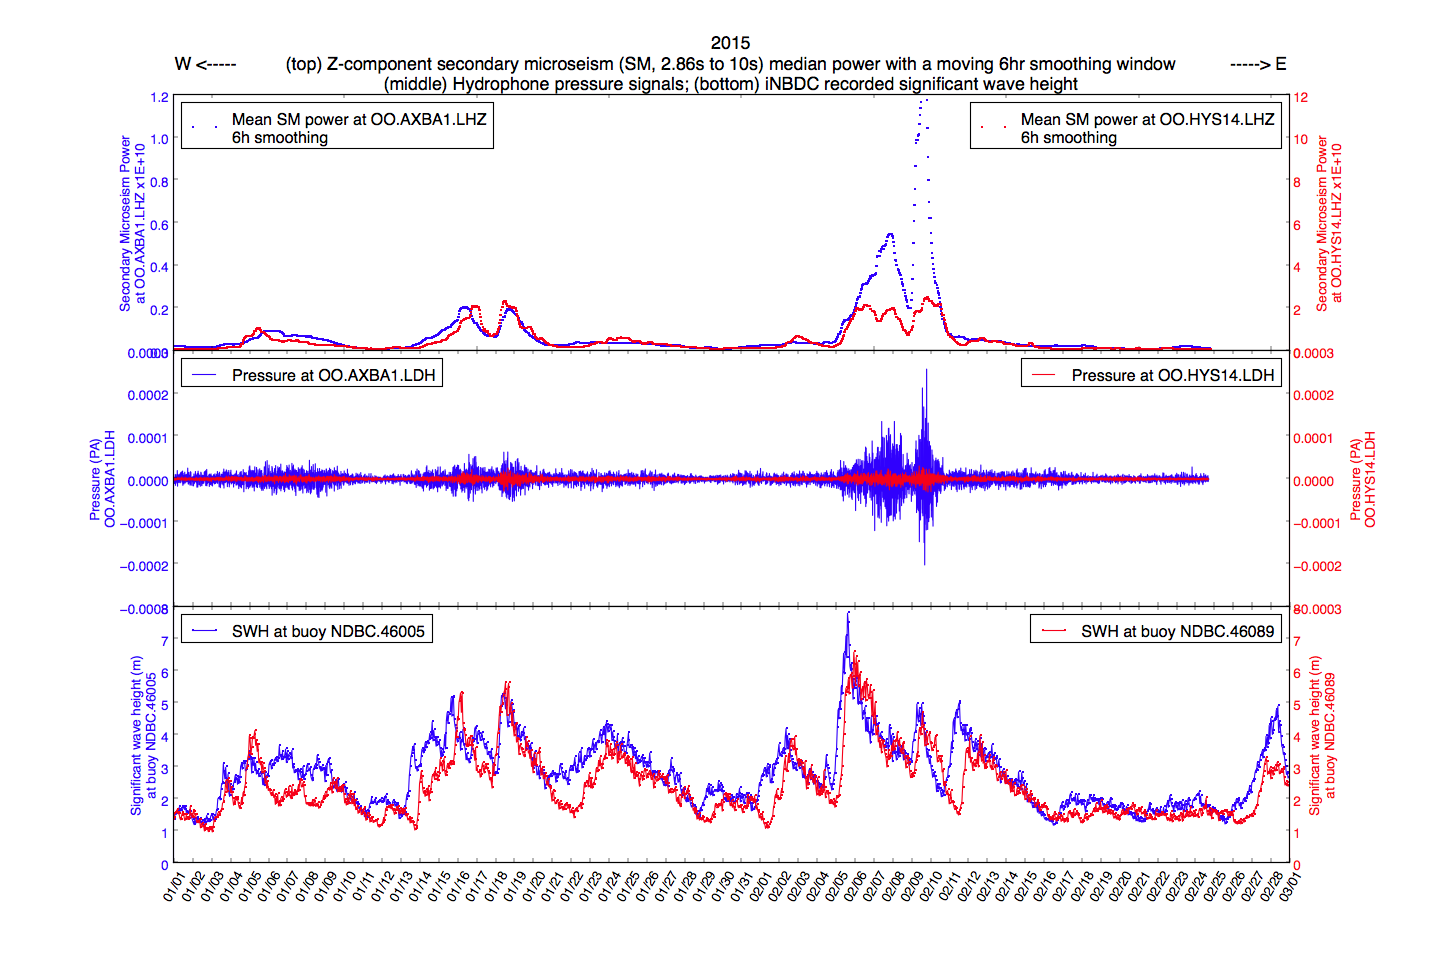
Results of this highlight are presented below in four figures (one figure per year). In each figure the top panel shows the median secondary microseism energy for a moving 6 hour window for a station from the western cluster in blue and for a station from the eastern cluster in red with the corresponding vertical axis in the same color. Note the significantly different vertical scales when comparing the microseism power plots. This suggests eastern stations often experience much stronger microseisms.
The second panel shows a plot of the corresponding hydroacoustic channel filtered in the same 0.1 to 0.35 Hz band. In each figure the same scale is used to plot the hydroacoustic waveforms from the western (blue) and eastern (red) stations. In general there is a strong correlation between signals observed on the hydroacoustic channels and the microseism energy anomalies. In contrast to microseism plots, the pressure traces from the east in general have lower amplitude compared to the traces from the west. In addition, the sharp spikes on the pressure channels that represent “short-duration” signals correlate with jumps on the microseism energy plots.
The bottom panel displays the significant wave height (SWH) as recorded by the buoy stations to the west and east. Although amplitude departures from the median are smaller for the buoy data and appear noisier, the overall trend of SWH plots correlate well with the largest amplitudes in the pressure and microseism plots.
Citations and DOIs
- Trabant, C., A. R. Hutko, M. Bahavar, R. Karstens, T. Ahern and R. Aster (2012), Data products at the IRIS DMC: stepping-stones for research and other application, Seismological Research Letters, 83(6), 846:854. https://doi.org/10.1785/0220120032
References
- Longuet-Higgins, M. S. (1950), A theory of the origin of microseisms, Philos. Trans. R. Soc. London, Ser. A, 243, 1–35.
Credits
- IRIS DMC Data Products Team


