EarthScope is Seeing Earthquakes in 3D
USArray Wave Visualizations
As earthquake waves travel along the surface of the Earth, they cause the ground to move. These ground motions can be captured and displayed as a movie, known as a USArray Wave Visualization. These movies provide a visual demonstration of the three dimensional nature of these often indiscernible movements.
USArray Wave Visualizations are created for all large earthquakes worldwide.
USArray Wave Visualizations are created for all large earthquakes worldwide.
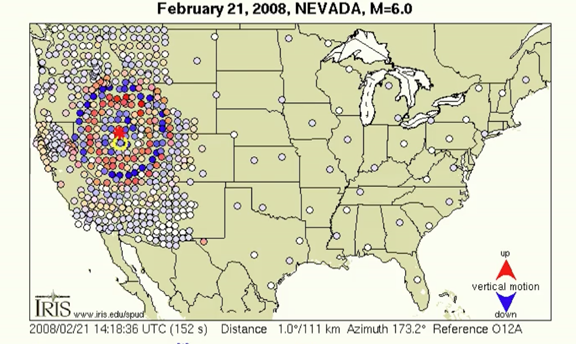

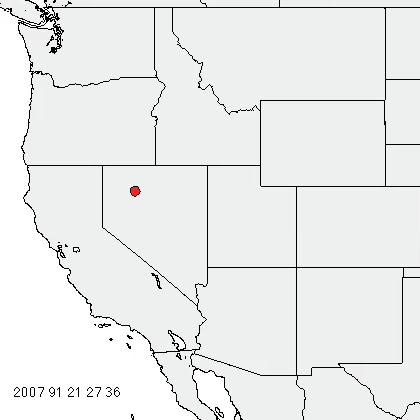
Wells, Nevada Magnitude 6.0
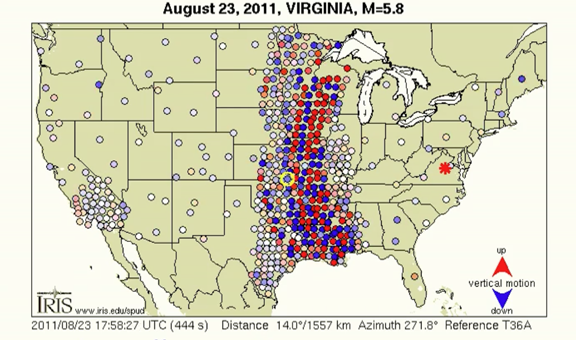
Mineral, Virginia Magnitude 5.8
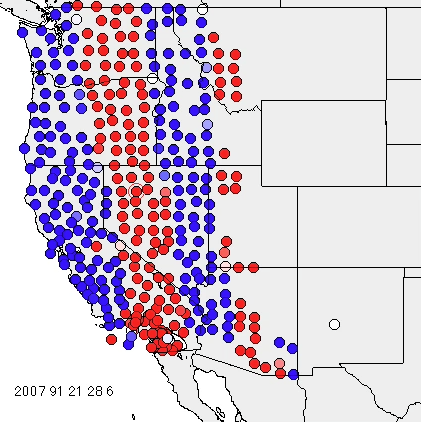
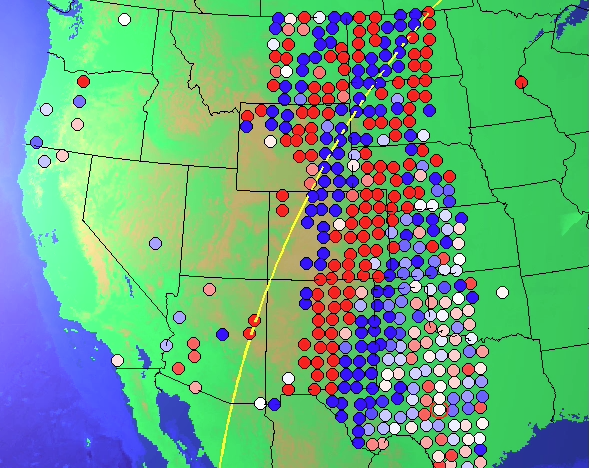
Click on a map to see a visualization for several recent earthquakes.
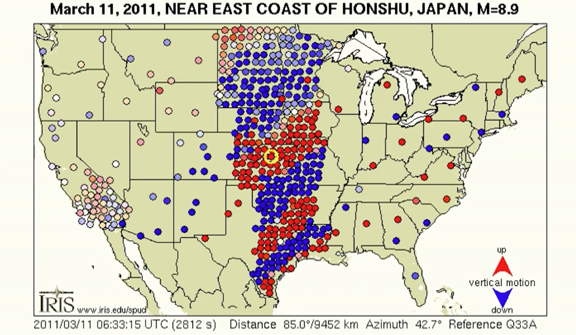
Japan Magnitude 8.9
Haiti Magnitude 7.0
Each circle on the map represents one seismograph. The color of each circle represents the amplitude, or height, of the earthquake wave detected. Blue represents downward ground motion, red represents upward ground motion, and darker colors indicate larger amplitudes. This is the actual data recorded by the seismometers during each earthquake.
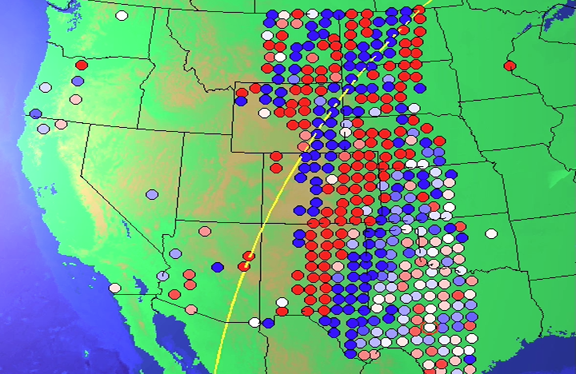
How does a dense array of seismometers help give us a better view of an earthquake?
One station
Multiple Stations
Multiple station with 3 dimensions
