Web interface help 
The Web interface to BUD was originally developed to check on the status of the data flow but has been expanded for general use. Users can browse data using an applet-driven viewer, ftp data, or construct a detailed timeseries report.
Define a data filter 
You must select at least one network from the list. All other fields may be left with the default value (asterisk) which acts as a wildcard. The select region fields may also be left with the default values (global) or defined by the user.
Advanced Options 
Once you define a data filter, you can scroll to the bottom page and select the Today or Select Date button to move ahead in the query process OR you can set some more options.
Map options 
You can only select one map option per query. Maps are of station locations, data feed latency (how long since the DMC last received data) or data latency (how old is the timestamp of the last data received). The map option appears as a button on the resulting query page (i.e. the map is not generated right away).
Show Table options 
Again, these latency table options are only valid if you are viewing Today’s data. The data can be sorted or “summarized” in three ways:
- by Network – only the time for the most recent station/channel in the chosen network is displayed. This is a quick way of checking if a network is operational; if the data is really flowing – at least from one station – in real or near-real time.
- by Station – times are broken out by individual stations
- by Channel – times for all selected channels are displayed
Today or Select Date 
- Today – looks only at data received since midnight (UTC time).
- Select Date – gives the user a chance to view a calendar of available data (still in the BUD system) for all networks selected in the filter step. (More details about the calendar pages below.)
What happens next? 
If you select Today: 
- Set Time Window – The default is all day
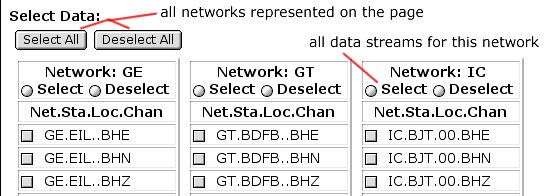
- Select Data – The first
Select Allbutton will mark all data available for all networks, stations and channels on the page. If you only want to select all for one (or some) of the networks, click theSelectbutton that appears under the name of the Network. You can also select individual data streams by clicking the checkbox next to each listing. The listings are written as<Network>.<Station>.<Location>.<Channel>
- View traces – An applet-driven viewer (called Wiggles) displays the chosen data, one channel per line.
For better performance of Wiggles, set a small time window and select a small set of data if:
- There is low throughput between your browser and the IRIS DMC: Detect Throughput
- Your browser uses a JDK version prior to 1.1.7: Detect Your JDK Version
If you chose to Highlight Gaps in the data, click the checkbox before pressing the DMC (redraw trace) button.
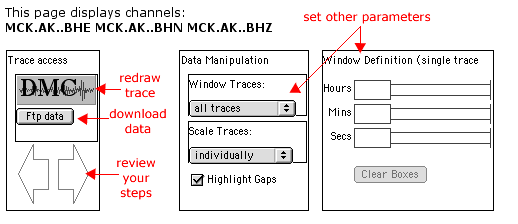
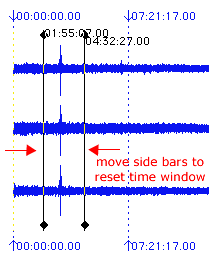
Wiggles allows the user to refine the time window of the original timeseries trace by moving the side bars in with your mouse (Screen Shot 3). You must click the DMC button to redraw the trace after setting a new time window (Screen Shot 4).
You can move the side bars for a global time window change or select to window the traces one by one (shown in Screen Shot 2). You can also perform a numeric change on individual traces.
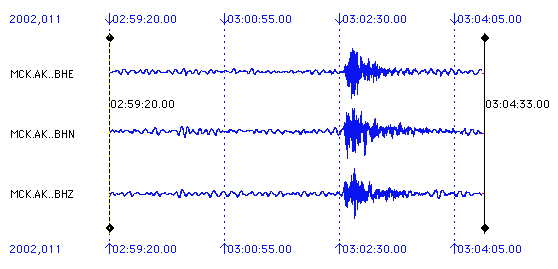
Once you are happy with your time windowing, you can download the resulting miniSEED file via ftp.
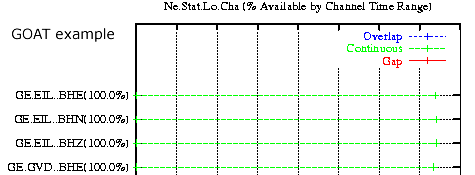
- View Timeseries (GOAT) – GOAT (Gaps, Overlaps and Timeseries) is a tool designed to create a detailed report about a data set’s continuity.
- FTP data – Once the data selection is complete, clicking the FTP data button while start a file building process and you will be directed to an area where the resulting miniSEED volume of selected waveforms can be collected.
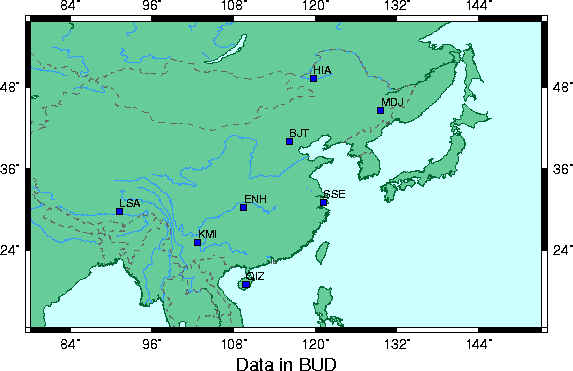
- Make Map options – If you selected a map option, a button will appear at the top of the screen directing you to create the map. A new window will appear with the map and more options for you to set if you wish.
- Latency Information – If you selected to show latency information, you should see added columns in the data table(s) that report the time and the latency calculation. These are color coded by latency for quick browsing.

If you choose Select Date: 
- Inventory Calendar(s) – Data can stay in the BUD system for several weeks (to months) before it becomes QC’d data in the deep archive. A calendar of available days is created for each network selected. Clicking on a date in the calendar will do one of two things:
- If you are viewing only one network OR the
Selectcheckbox is clicked for only one of the represented networks, a table of available data will be generated just for that network. - If you have multiple networks represented on the page, you can click the
Selectcheckbox for each network you wish to view and then select a date on ANY of the selected network calendars, and all the selected networks will be included in the generated table.
- If you are viewing only one network OR the
Make Map option 
Only the Location Map option is available for this selection (under Advanced Options on the first BUD page).
See the section above (If you select Today…) to see what happens after you have selected a date.
About the BUD Directory Structure and Data Files 
BUD is intended to be independent of the incoming data source, and as simple and easy to use as possible. The BUD data organization consists of a top level directory containing Network/Station directories. In the Station directories are miniSEED data files (sorted by channel day). This organization can produce a lot of files if there are many days of data on-line, but BUD is intended as a staging area, so this is not a problem.
An inventory of networks and stations in a BUD directory is immediately visible by inspection of the BUD directory structure. An estimate of whether there is data for a particular channel, day, and time in the BUD directory can be derived from file modification time and an expected latency associated with a channel. The channel day miniSEED files are fairly small and so, quick to read. These features of the BUD directory/file structure make it fast and easy to find out what data is available and to extract data.
ew2mseed 
Currently, one data acquisition program exists that outputs a BUD directory structure – ew2mseed. ew2mseed is an Earthworm WaveServer Client and was developed by ISTI under contract to the DMC. The DMC also has a program which will take miniSEED files and write them out to a BUD directory structure.
Present Participants in BUD 
- SPYDER® – This event-based data now comes through the BUD system (with the exception of a few dial-up stations). The DMC’s WILBER II tool accesses BUD for SPYDER® data.
Future BUD Participants 
- The DMC is working on a FISSURES seismogram server which returns BUD data. Several clients are being developed which will access this server.
- An AutoDRM option is also under development.
Effort was made to keep the Web interface to BUD a standalone tool so that it could be distributed to interested parties. If you are interested in writing a BUD directory structure and installing a BUD Web interface on your server, please contact Sandy Stromme at the DMC.
Categories
Release date: Modified date:


