This Special Event web page is intended to provide direct links to and images of data and materials available from SAGE programs and preliminary research results from the seismology community. We welcome any additional contributions containing original content that might be of interest to the research community. Please send them to the email address listed below.
SAGE does not necessarily endorse the views or scientific validity of the posted items.
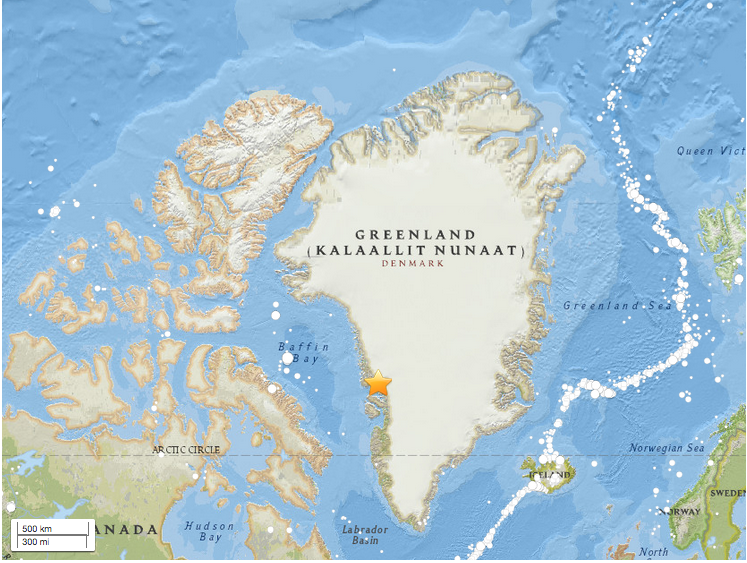
At about 23:39:12 UTC on 2017-06-17 a M 4.2 Landslide 107km N of Uummannaq, Greenland (71.640°N, 52.344°W) induced a large contained tsunami.
Email contributions to:
special-events@lists.ds.iris.edu
Note:
All scientific contributions addressed to the community will be forwarded to the special-events mailing list.
If you DO NOT want your email being forwarded, please address it to SAGE or explicitly write
do not forward.
Quick Links
Links 
USGS Landslide Hazards Program – Preliminary Analysis of Satellite Imagery and Seismic Observations of the Nuugaatsiaq Landslide and Tsunami, Greenland
USGS Earthquake Hazard Program – M 4.2 Landslide – 107km N of Uummannaq, Greenland
AGU Blogosphere – Nuugaatsiaq: A large landslide-induced tsunami on Saturday night?
AGU Blogosphere – Much more detail about the Greenland landslide and tsunami, including images and video
Quake Stories by Anthony Lomax – Nuugaatsiaq Greenland landslide and tsunami: Seismograms suggest several stages of land failure
Video from KNR News Nutaarsiassa (YouTube) – Nuugaatsiaq
Video from Kunuunnguaq Petersen Geisler (Facebook) – Ulorianaq
Tweet by Anthony Lomax – Nuugaatsiaq tsunami
GLISN – Greenland Ice Sheet Monitoring Network
Seismic observations from Nuugatsiaq slide/tsunami 
Authored by:
John Clinton, ETH Zurich
Tine Larsen, Trine Dahl-Jensen, Peter Voss, GEUS Copenhagen
Meredith Nettles, Colombia University, New York
Context and seismic monitoring 
On Saturday evening on the 17th of June, 2017, a large landslide occurred in NW Greenland, around 20km from the small fishing village of Nuugaatsiaq, population 100, which lies on an island in Karrat Fjord. The slide slipped into the fjord, inducing a large seiche. Shortly afterwards, waves inundated much of the village, producing widespread destruction – 11 houses were swept out to sea, and 4 people are missing, presumed dead. Though the damage was greatest at Nuugaatsiaq, the villages of Illorsuit and Niaqornat were also strongly affected. In total, approximately 200 people have been evacuated from the 3 villages, and the public in the wider area is very much on edge, not least because there appear to be additional unstable areas adjacent to the causative slide.
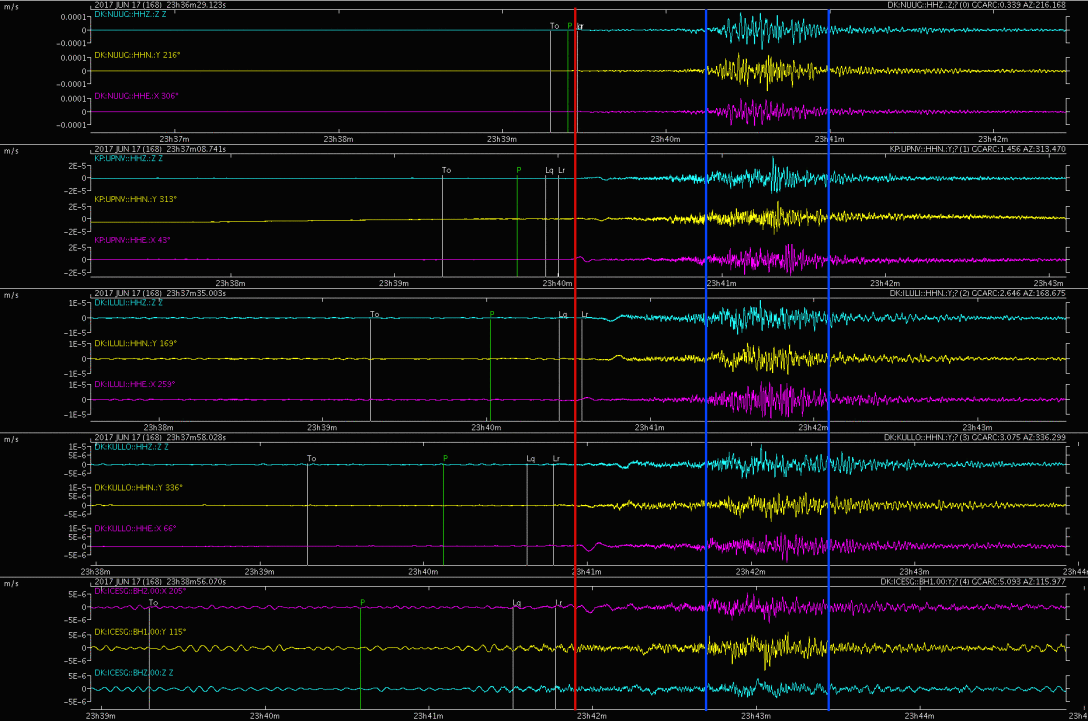
The slide was so large that it generated seismic energy visible across the globe, and very first analysis suggested the event was caused by an earthquake with a magnitude of Ml4.1. Subsequent careful examination of the available seismic waveforms indicates no significant triggering tectonic event directly preceded the slide. The landslide lit up all stations from GLISN (http://glisn.info), a modern 30-station-strong broadband seismic network covering Greenland and built over the last decade through an international effort led by GEUS and IRIS. A GLISN broadband seismic station, NUUG, installed by ETH Zurich, has been operational in the town since 2010. The STS2 is located in a small purpose-built hut at 36m elevation on the outskirts of the village, and so was not damaged by the inundation. The station recorded the seismic energy generated by the slide and responded to the ground tilt induced by the fluctuating water levels from the resultant seiche; its waveforms were transmitting to global data centers in real-time until about 10 minutes after the large waves began arriving, when power and communications were lost at the village. The complete dataset of the event was retrieved when power was temporarily reconnected the following Tuesday.
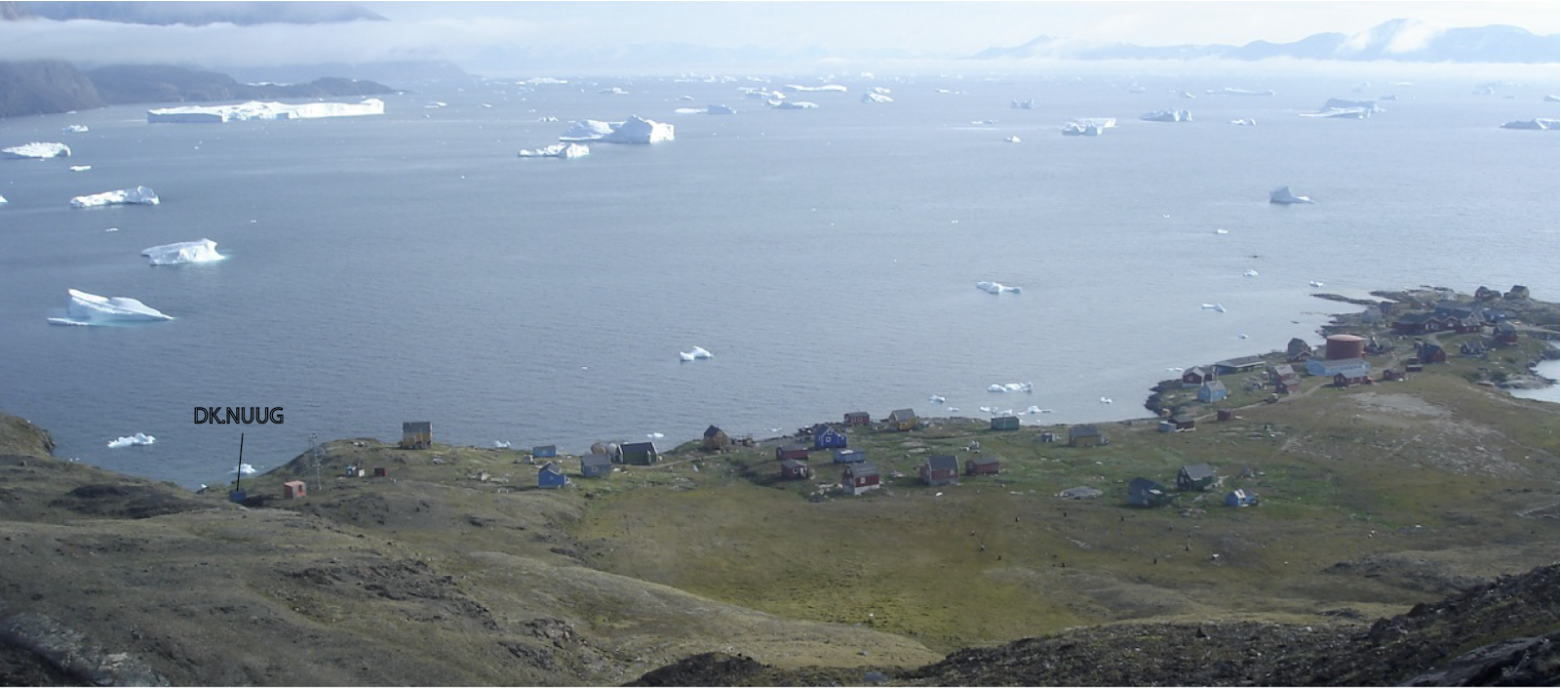
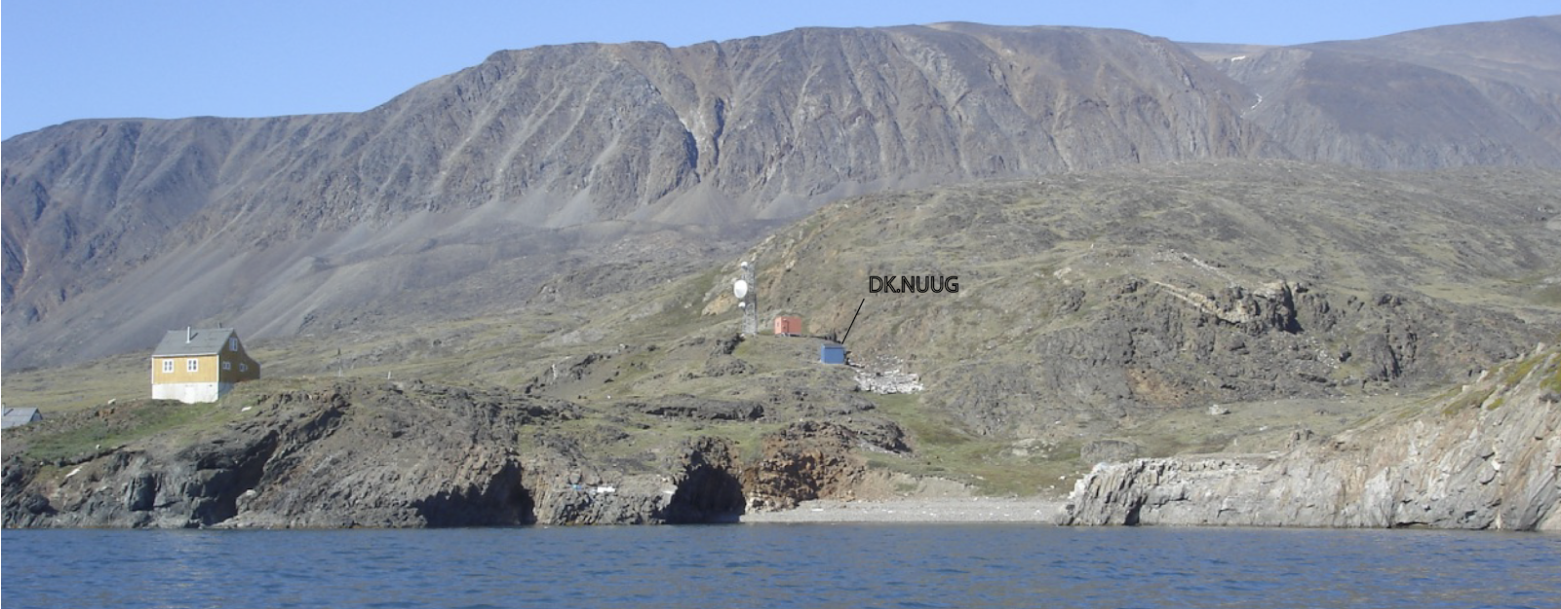
Observations from NUUG 
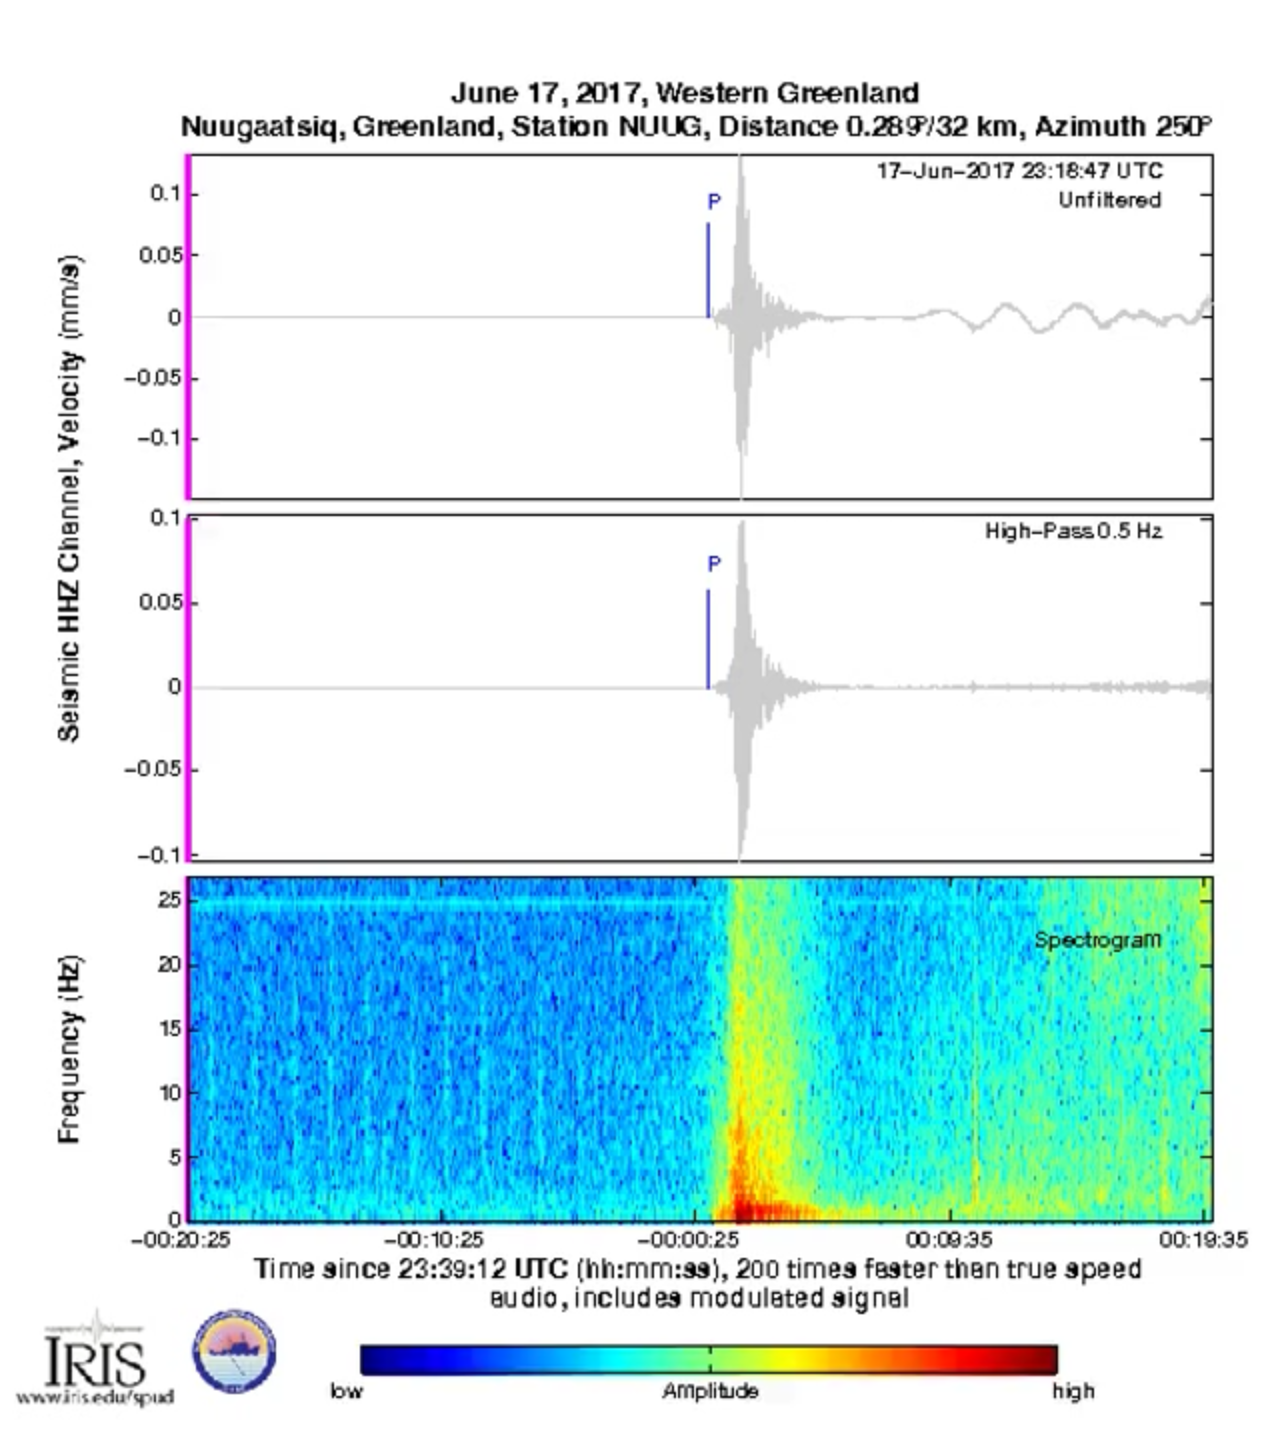
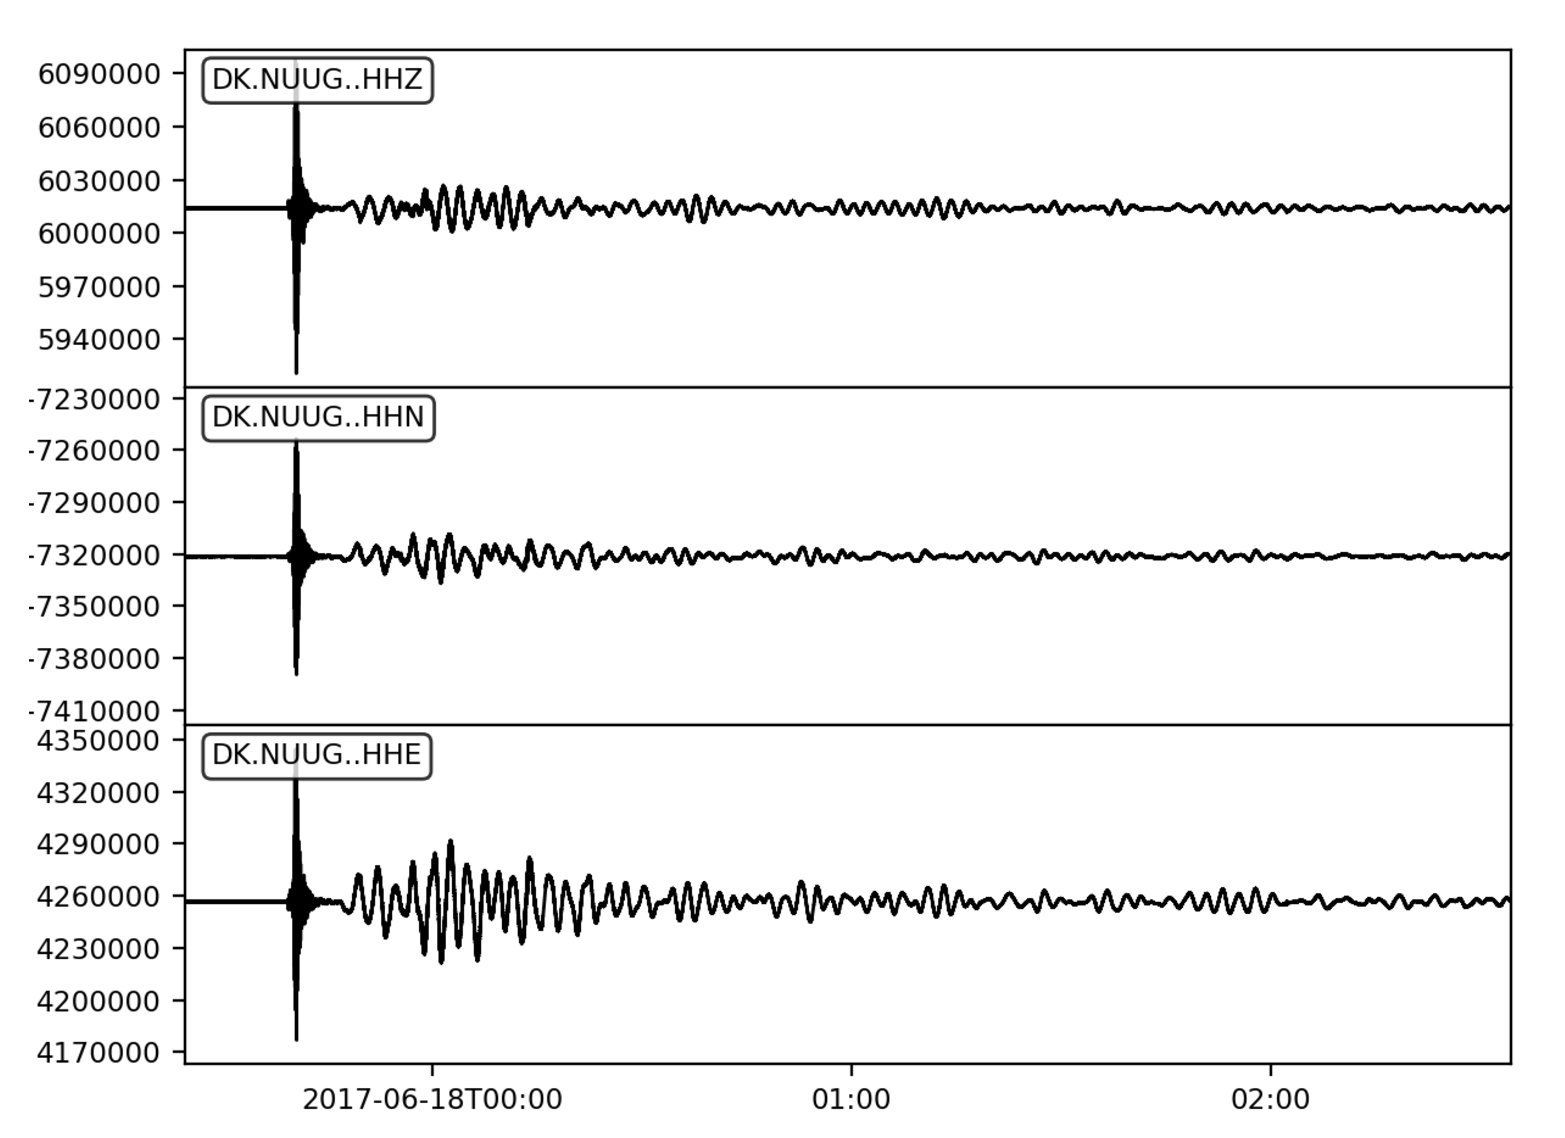
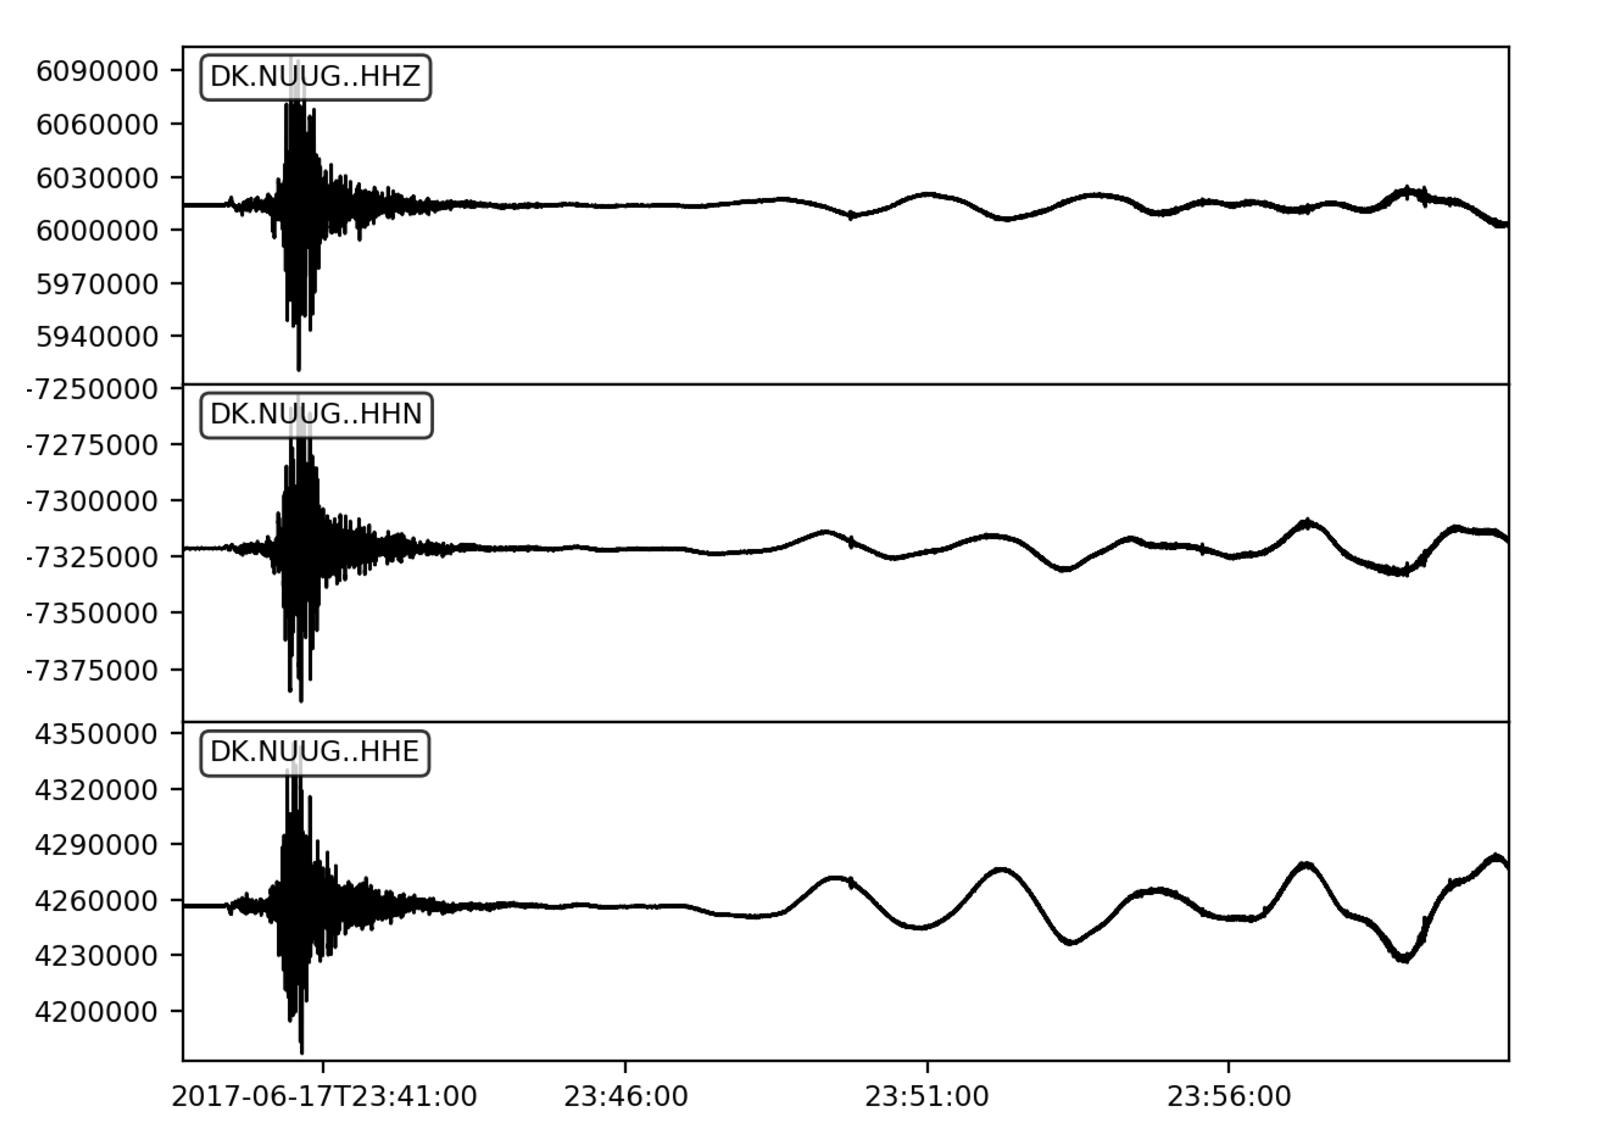
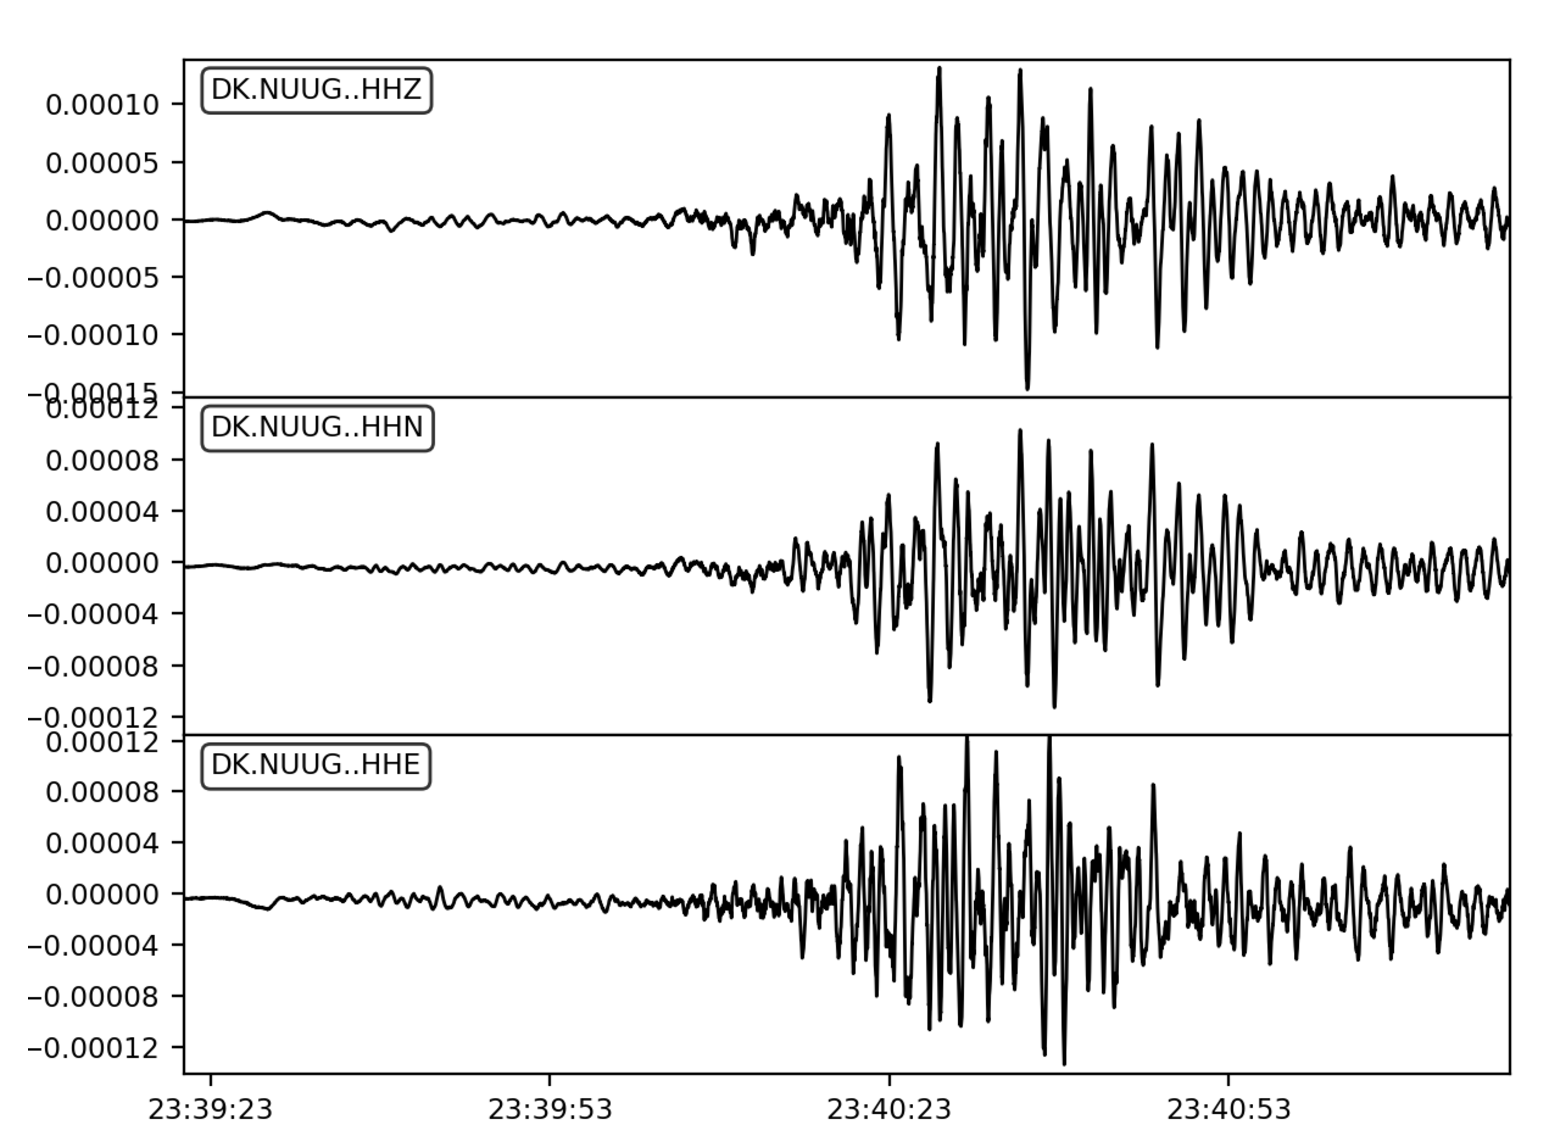
The timeseries from NUUG clearly records both the slide and the resulting inundation events. Seismic waves from the landslide reached the town at 23:39 UTC and had a duration of about 5 minutes. This long duration and the relatively monochromatic, long-period signal that slowly increases in amplitude are indicative of complex landslide signals. Long-period, large-amplitude water waves pounded the shoreline of the village for hours after the landslide. These signals emerge in the seismograms around 7 minutes after the start of slide, and include over 20 cycles of waves, with a period of 3 minutes, lasting over 3 hours. This signal is the broadband seismic sensor responding to ground tilt induced by the changing sea level.
Comparisons with glacial calving events 
This station has in the past recorded similar seiche signals from glacier calving events from nearby Rink Glacier (doi:10.3189/2013JoG12J118). Such calving events are detected as glacial earthquakes (doi:10.1126/science.1088057), and a large example occurred earlier this year. The following figures compare seiche signals induced from the slide and a glacial earthquake. They are remarkably similar in frequency and duration, even though the amplitude is about a factor of 30 larger for the destructive signal following the landslide.


Observations from regional and global seismic stations 
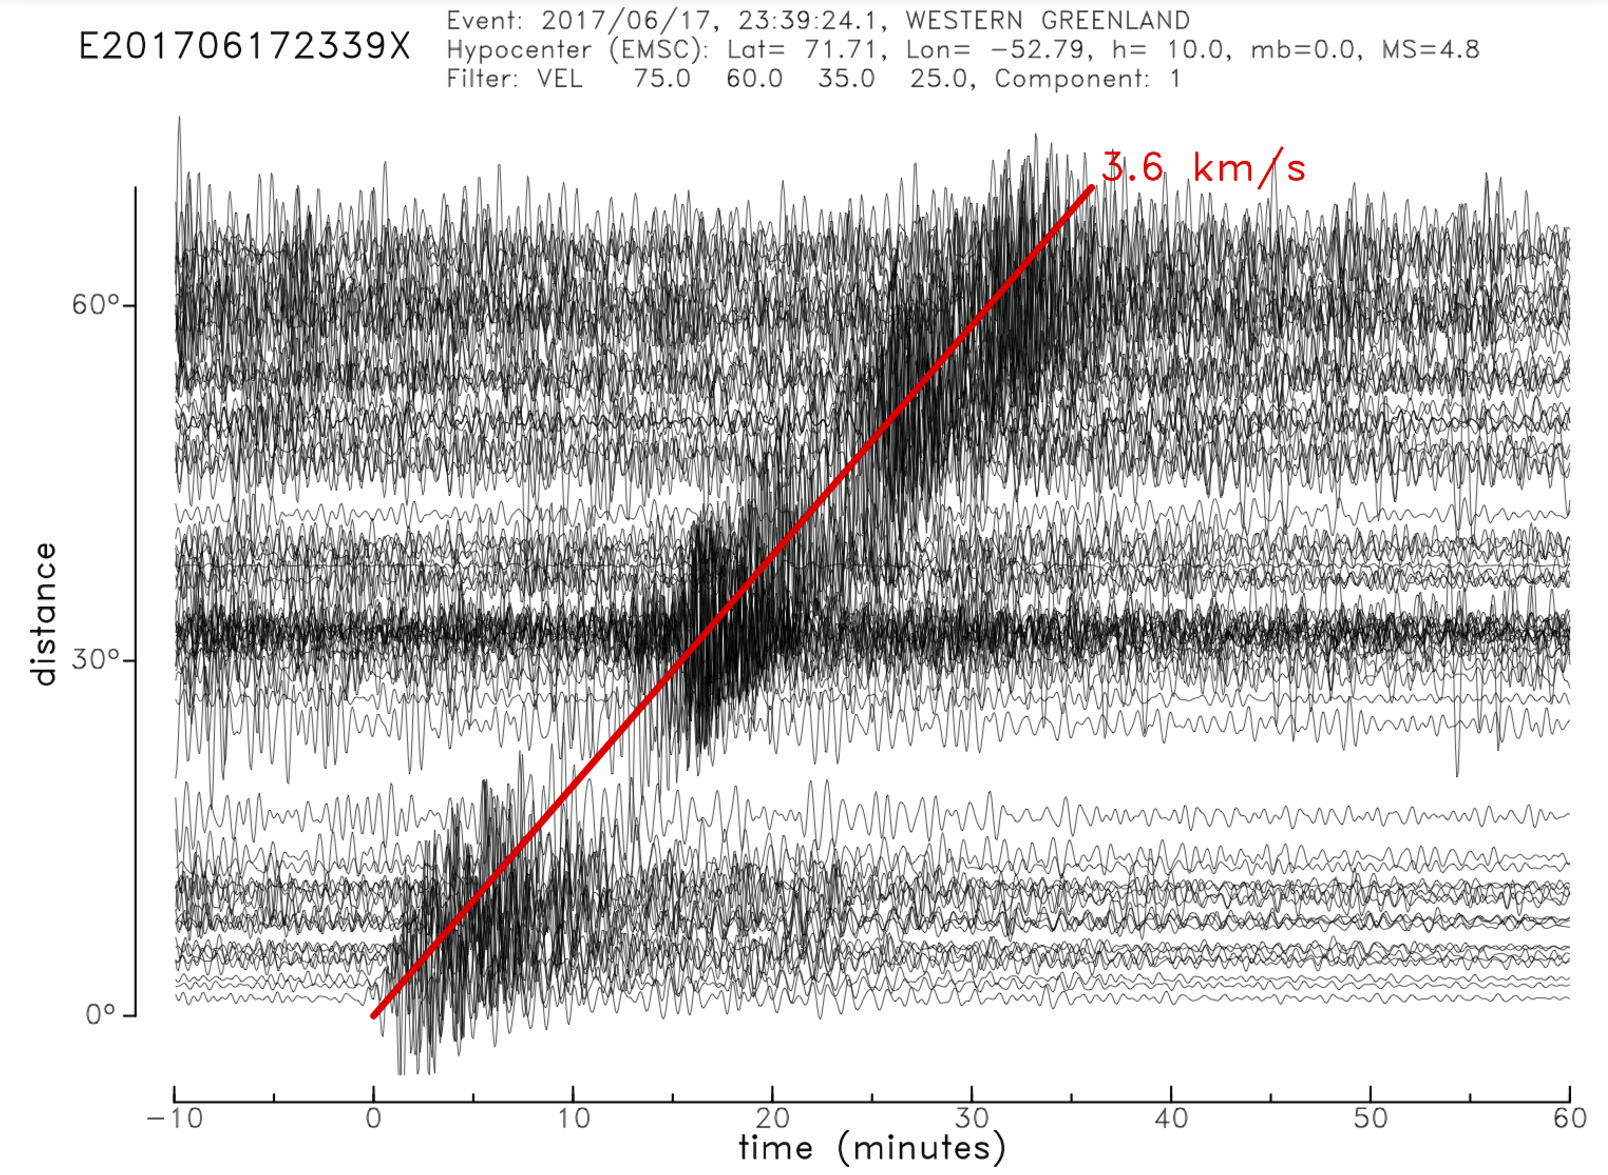
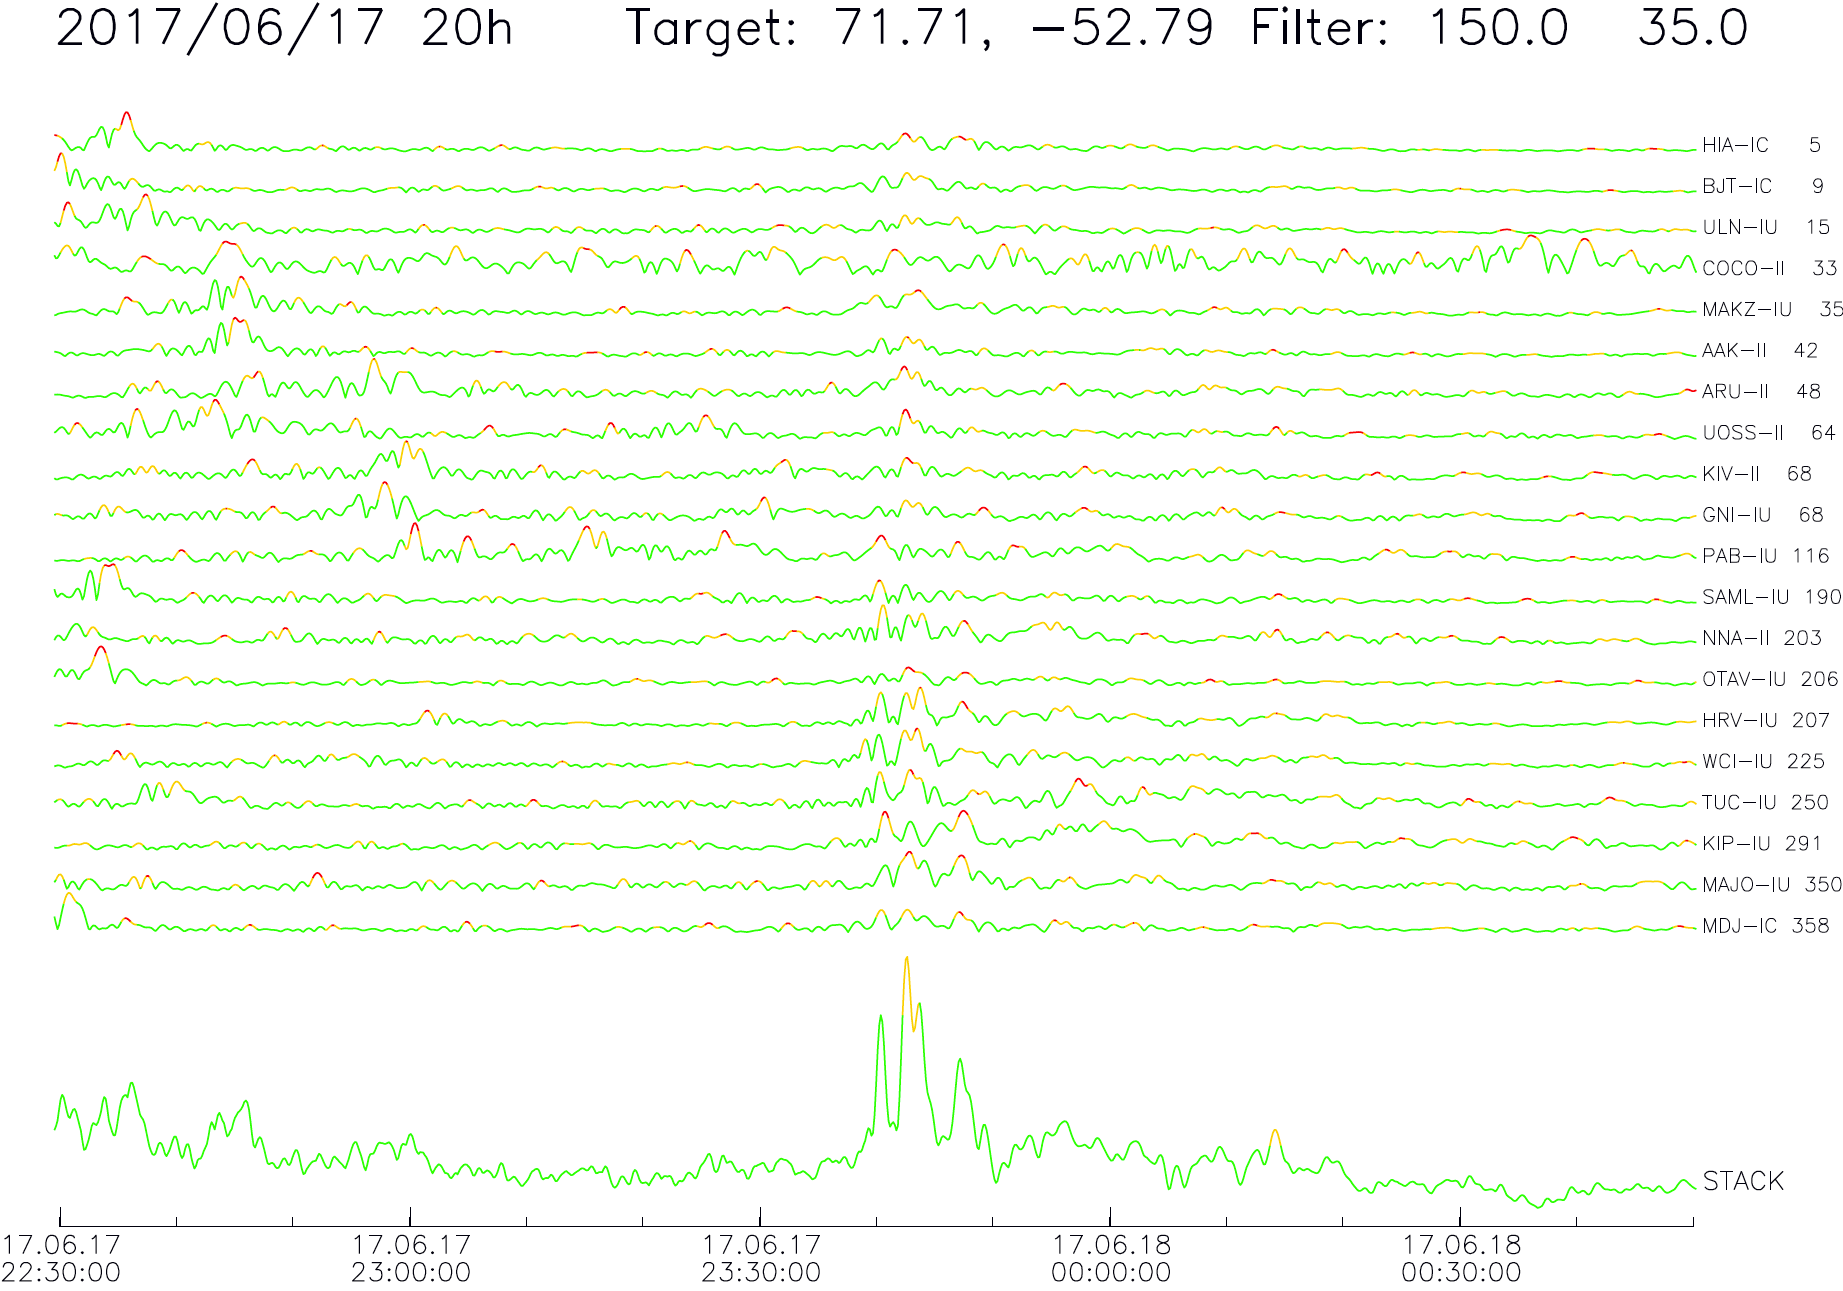
The long-period signals observed across the GLISN network, and around the globe, are consistent with generation by a landslide source, and show larger amplitudes and greater complexity than the glacial-earthquake signals regularly observed as a result of large glacier-calving events at nearby Rink Glacier. The long-period signal suggests failure occurred in two or more stages.
IRIS DMC Products 
SeisSound – An Audio/Video Seismic Waveform Visualization 
Other Images
Related Content
These other pages were tagged similarly:


