IRIS EPO team release the new IRIS Earthquake Browser (IEB)
The new IRIS Earthquake Browser (IEB) was released from beta in early October 2013 and is a refinement and extension of the tool created by Bruce Weertman in 2008. IRIS Education and Public Outreach (EPO) took over IEB last year and Russ Welti has been implementing quite a few changes and additions. If you haven’t used it lately you will see many of these changes at http://ds.iris.edu/ieb
You can explore 3.3+ million earthquakes spanning 50 years on a responsive, interactive map that provides a number of filters and viewing options. IEB helps users to visualize seismic patterns, see evidence of earth structure or even reveal human activity. Best of all it includes the (plugin-free) ability to view thousands of earthquakes in pseudo 3-D.
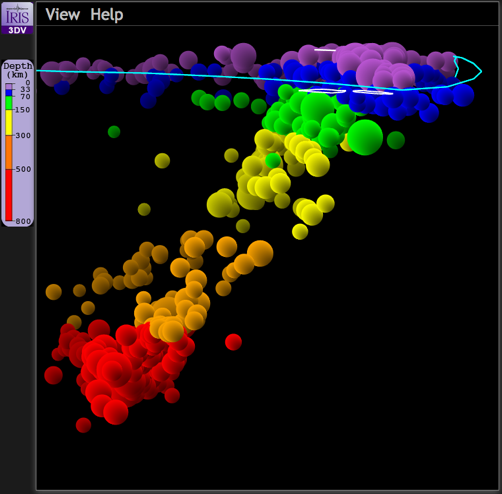
Exposing a plate boundary in a cluster of 5,000 earthquakes by freely rotating them adds a “new dimension” to the flat world of most seismicity maps. Shallow earthquakes can be moved aside to reveal the deeper ones and the spatial relationships amongst them all.
IEB’s 3D viewer appears to be the only tool of its kind: powerful, simple and requiring no plugins. 20,000 earthquakes have been loaded and rotated during development.
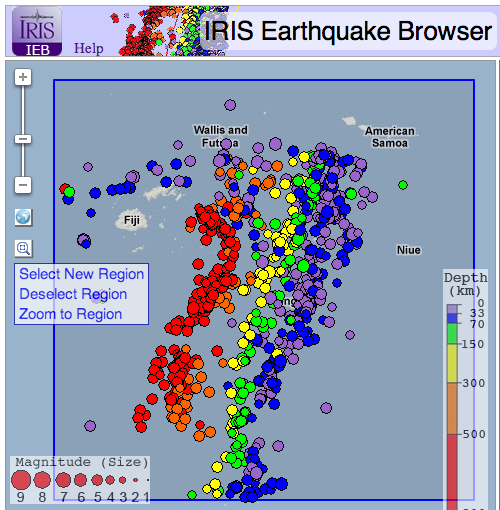
See Figures 1 and 2 for a comparison of the two IEB views over the Fiji region of the Pacific Ocean.
Features
So what’s new?
- 3D viewing of selections of earthquakes
- fast database of 3.3 million origins, updated at regular intervals from the IRIS FDSN event web service
- URLs (bookmarks) preserve nearly all aspects of the map, so you can return to the time, place, zoom level and other settings
- URLs can be constructed dynamically by other web pages, using parameters 90% in common with IRIS web services
- tectonic plate boundaries option
- hovering on quake table rows ‘bounces’ the quake the mouse is over
- social sharing and URL shortening are supported
- multi-sortable table view, which can easily be exported to other programs like Excel
- simplifications to make more layperson-friendly
- preset topics and regions that go directly to a place and time for use with lesson plans, special events, and related resources
- integration with the many new IRIS DMS products, and non-stop, direct access from Seismic Monitor event lists
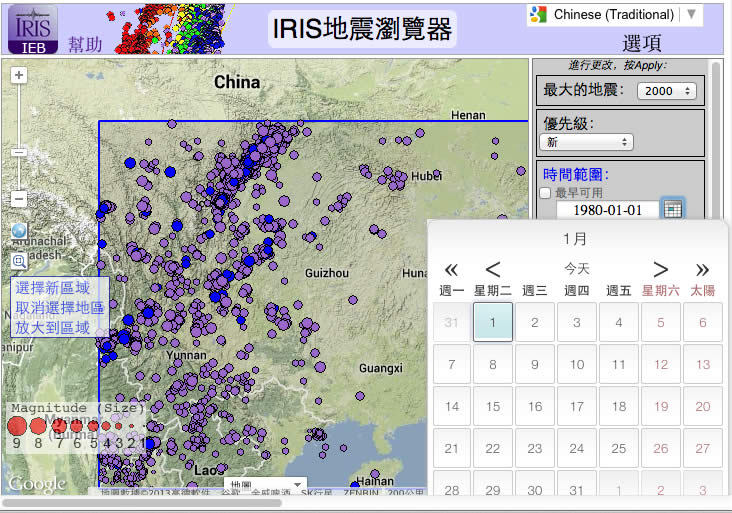
- multilingual translation and traffic funnels to better support our foreign user-base (see Fig. 5)
Features being considered for the future include:
- contour map of earthquake density
- use of IRIS-external data sources
- user-changeable color scheme for depths
- animation of events in time
User reaction has been favorable. There are about 1,000 unique web visitors a day on average, with an average of 6 minutes per visitor spent perusing IEB, with double or triple those figures on days of large earthquakes.
Coming soon: Contour maps of earthquake density
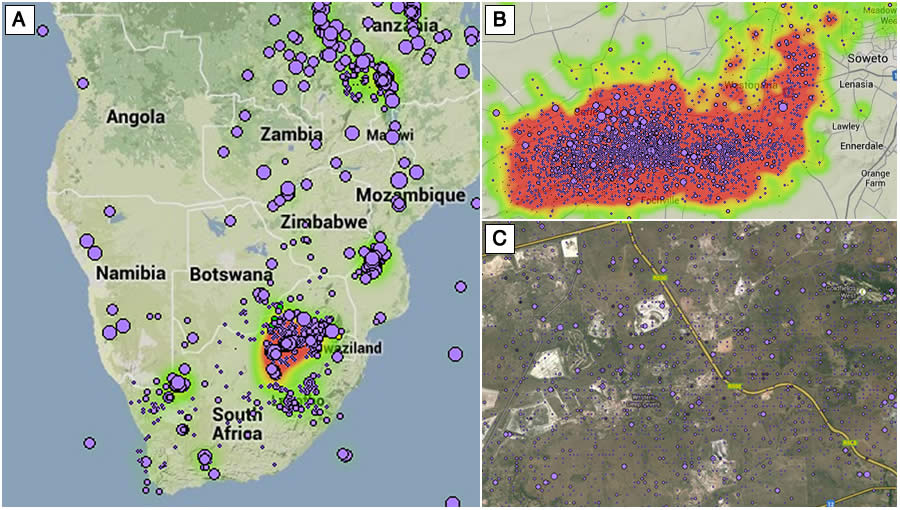
Contour maps reveal interesting features of the earthquake catalog, for example “uncovering” the 2002 Manchester swarm (Figure 3) and illustrating mining activity south of Johannesburg, South Africa (Figure 4).
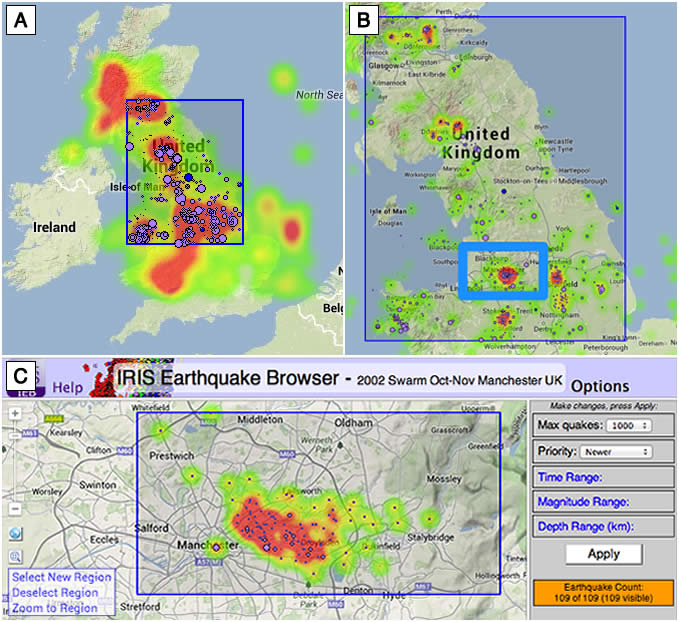
revealed. ( A ) Country-scale view of the United Kingdom, ( B ) The IEB interface zoomed in to the North of
England, ( C ) Zoomed-in view of the Greater Manchester area, showing the swarm distribution.
More information
by Russ Welti (1) , John Taber (2) and Bruce Weertman (3)
- (1) IRIS Data Management Center
- (2) IRIS HQ
- (3) IRIS DMC


