


MUSTANGular v2.0 - Improved Map Viewing of MUSTANG Metrics
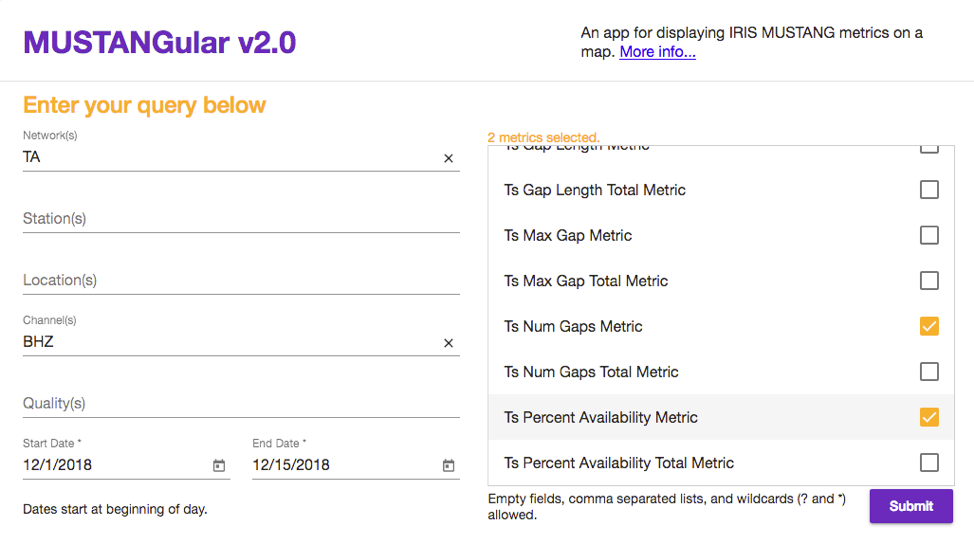
MUSTANGular is a web-based application that plots MUSTANG data quality metrics on an interactive map. Created by the Pacific Northwest Seismic Network and available at http://ds.iris.edu/mustang/mustangular, this tool enables speedy identification of anomalous metric values and exploration of geographic patterns. Version 2.0 of MUSTANGular was released in September 2018, with many improved features that make the application more intuitive, flexible, and useful. Users can now:
- select multiple metrics on the web form
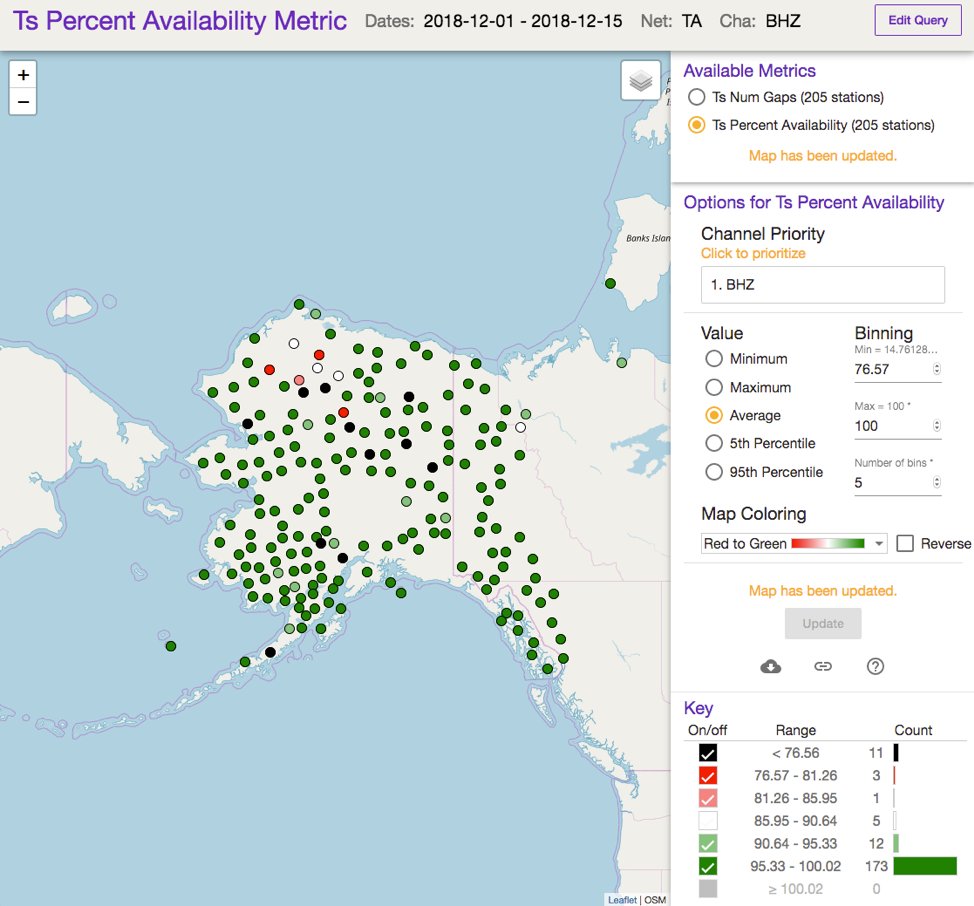
- easily switch between metrics in the map viewer
- plot the minimum, maximum, mean, 5th or 95th percentile value for the selected time period
- choose additional color scales
- view a metric timeseries plot by selecting a station on the map
- from the timeseries plot, click to view a station PDF
- download metric values from the application
Many thanks go to Kyla Marczewski (primary developer), Jon Connolly (project lead), and Paul Bodin (Network Manager) for making MUSTANGular available not only to IRIS, but also as an open source project on GitHub (https://github.com/pnsn/mustangular).
by Gillian Sharer (IRIS Data Management Center)


