Revisiting the Gulf of California Super GMV
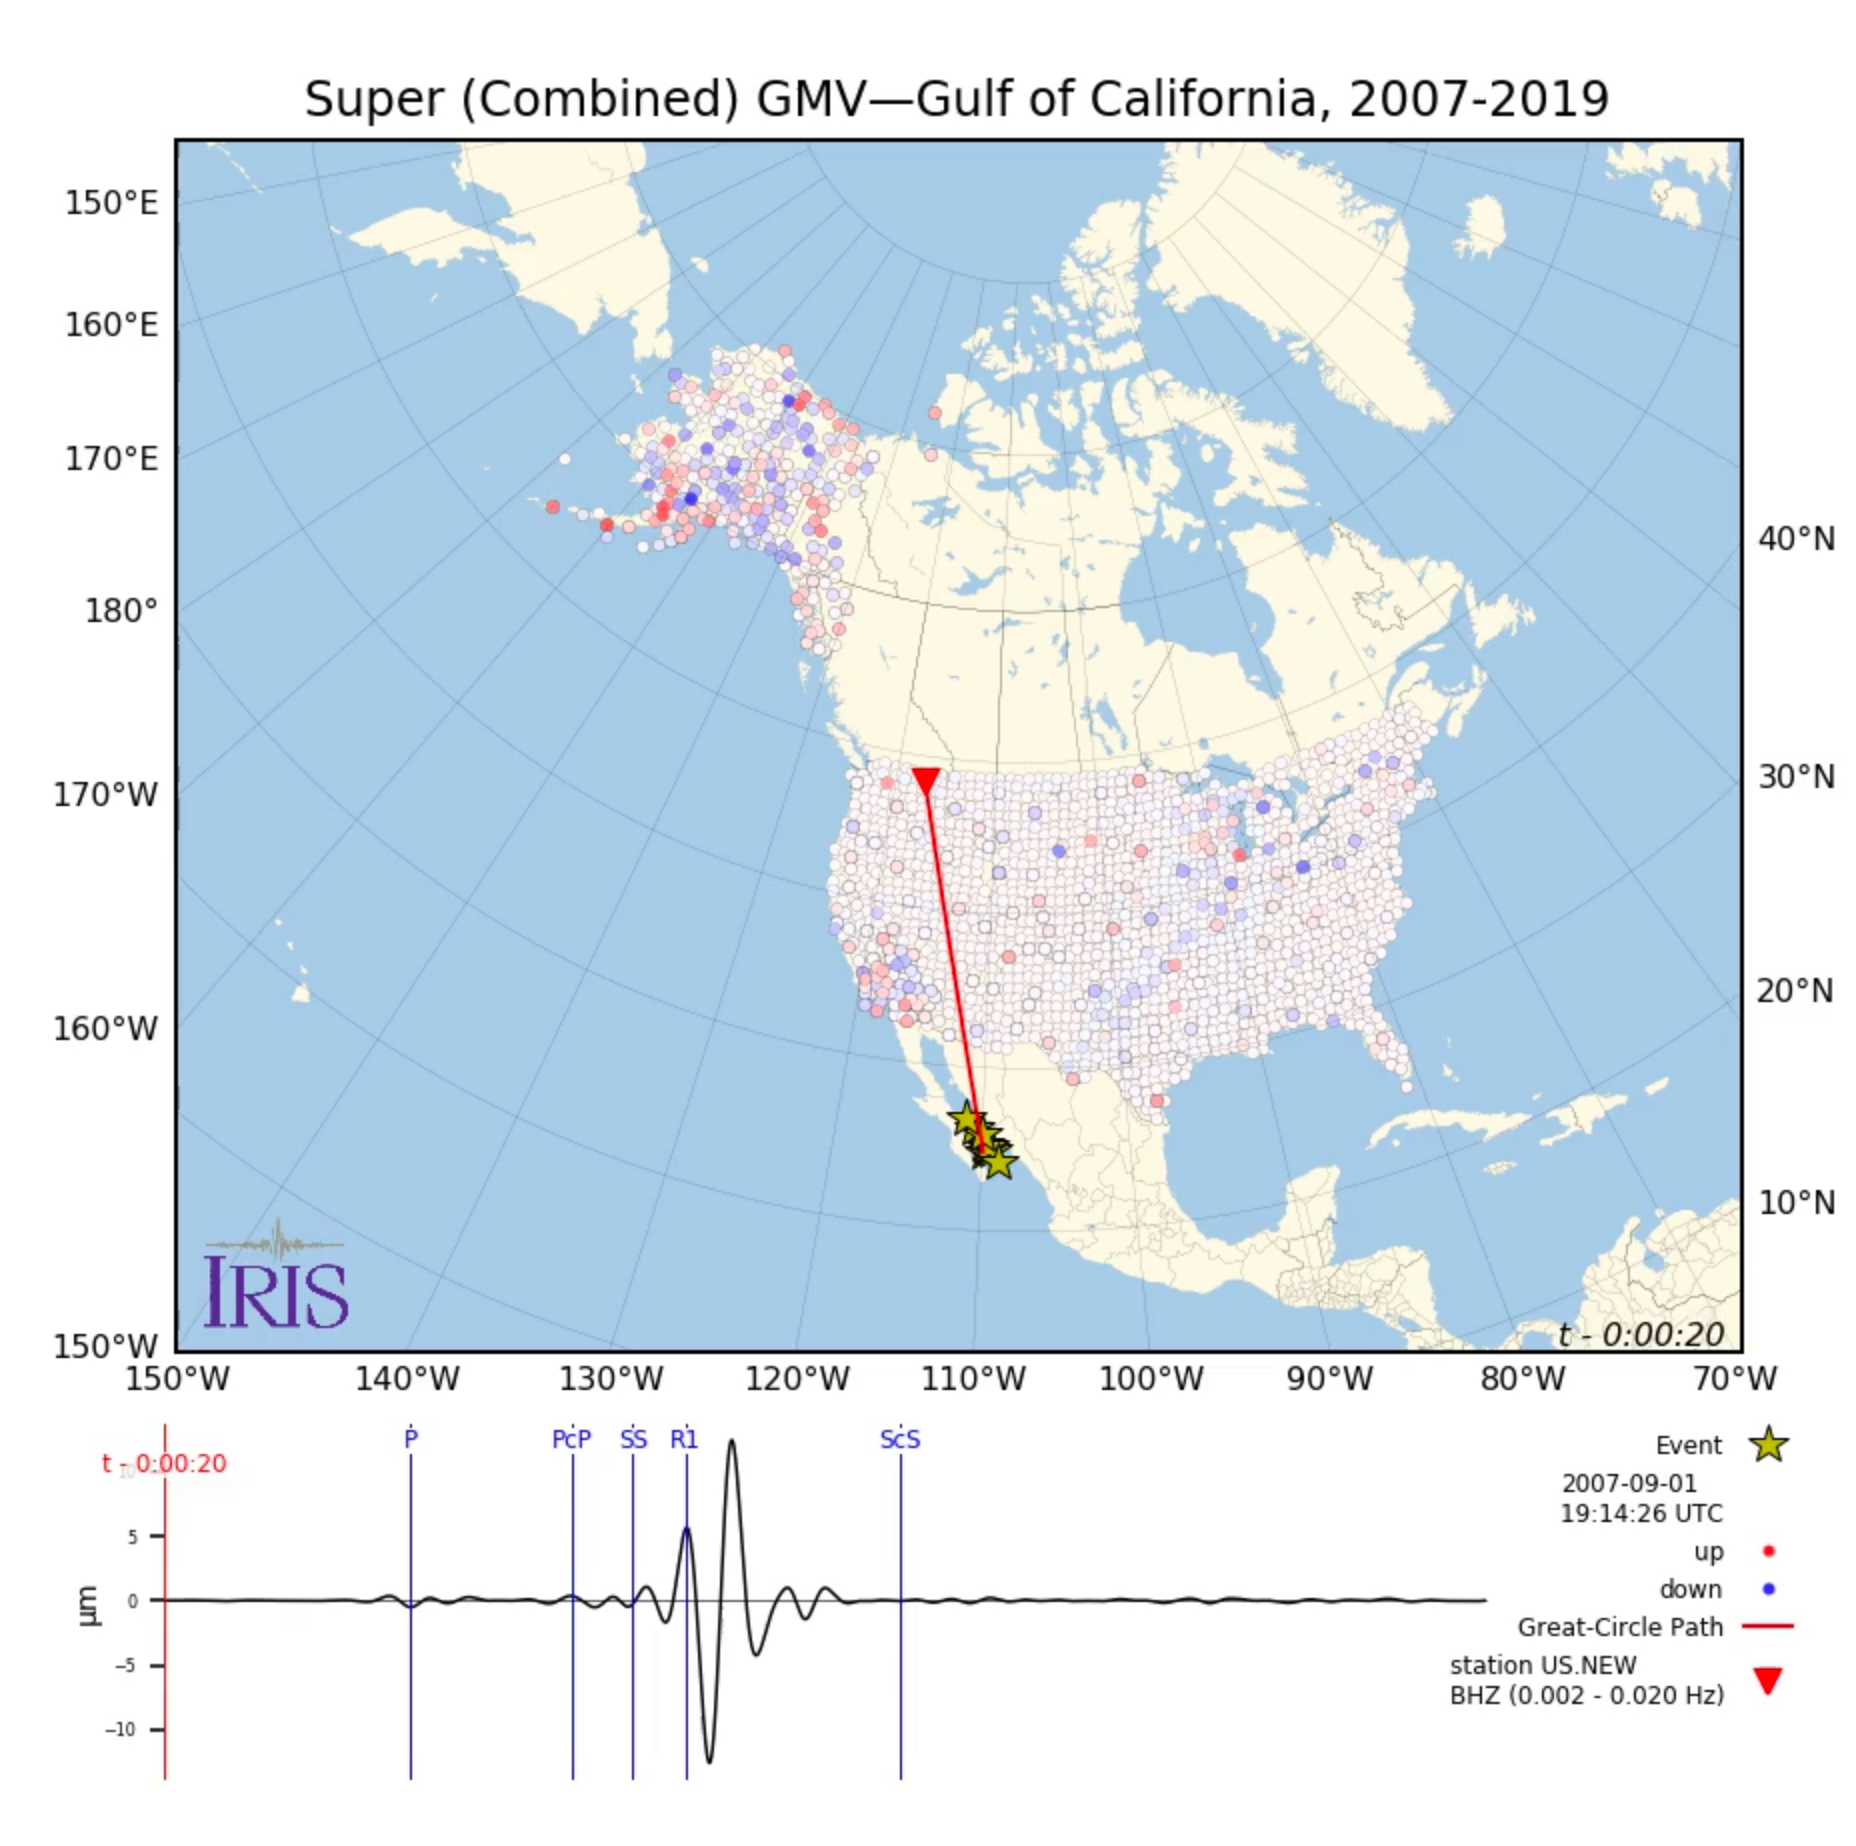
Between 2004 and 2013 the USArray Transportable Array (TA) moved eastward across the contiguous United States. Based on the TA’s observations during this time, the Ground Motion Visualization (GMV) data product produced over 1840 videos illustrating how seismic waves travel away from the earthquake locations. In these videos, the normalized recorded wave amplitudes at each TA location are depicted using colored station markers. In the 2013 Fall issue of the Data Services Newsletter we presented a Super GMV that was created by combining GMVs for six Gulf of California earthquakes (2007-2013) that had similar focal mechanisms and magnitudes. The resulting Super GMV simulated a GMV in an area larger than the TA’s footprint at the time of any of these six events. Hence, giving an impression that all TA stations locations (2004-2013) were occupied at the same time.
In 2014, the TA started moving to Alaska and its operation is scheduled to end in 2020. During TA’s deployment in Alaska (2014-2020), over 1000 additional GMVs have been produced. We also have used TA’s data from Alaska to expand the Gulf of California Super GMV by combining GMVs from 10 earthquakes that have occurred in the Gulf of California between September 1, 2007 and January 31, 2019. Therefore, illustrating how seismic waves travel away from the earthquake locations across the contiguous United States and Alaska.

by Manoch Bahavar (IRIS Data Management Center) and Chad Trabant (IRIS DMC)


