Summary
IPcrust2022 is a two-dimensional shear-wave model of the Iranian Plateau crust and uppermost mantle from a joint analysis of fundamental mode Rayleigh wave group velocities and P-wave receiver functions.
Quicklinks
Description
| Name | IPcrust2022 |
| Title | Iranian Plateau crustal shear wave model |
| Type | 2-D shear wave crustal model |
| Sub Type | S Velocity |
| Year | 2022 |
| Data Revision | r0.0 (revision history) |
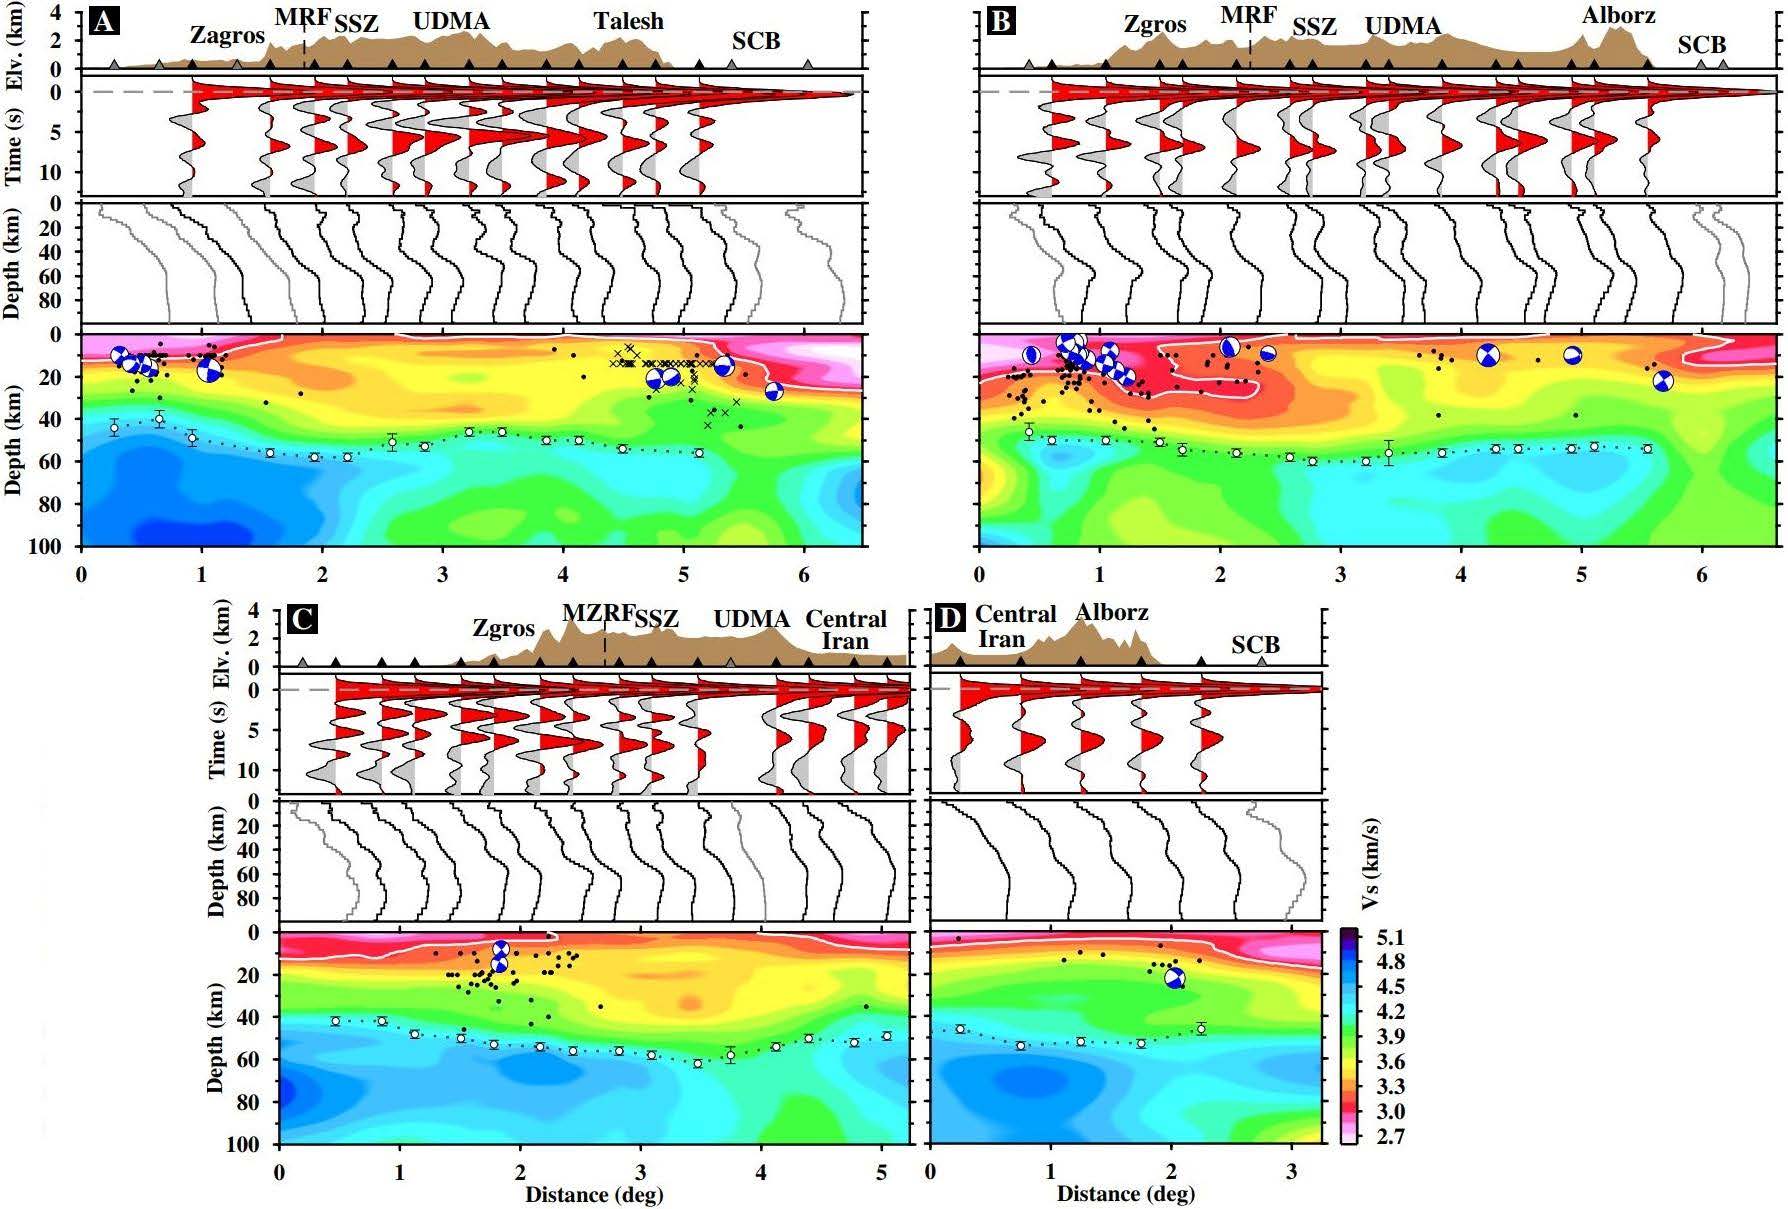
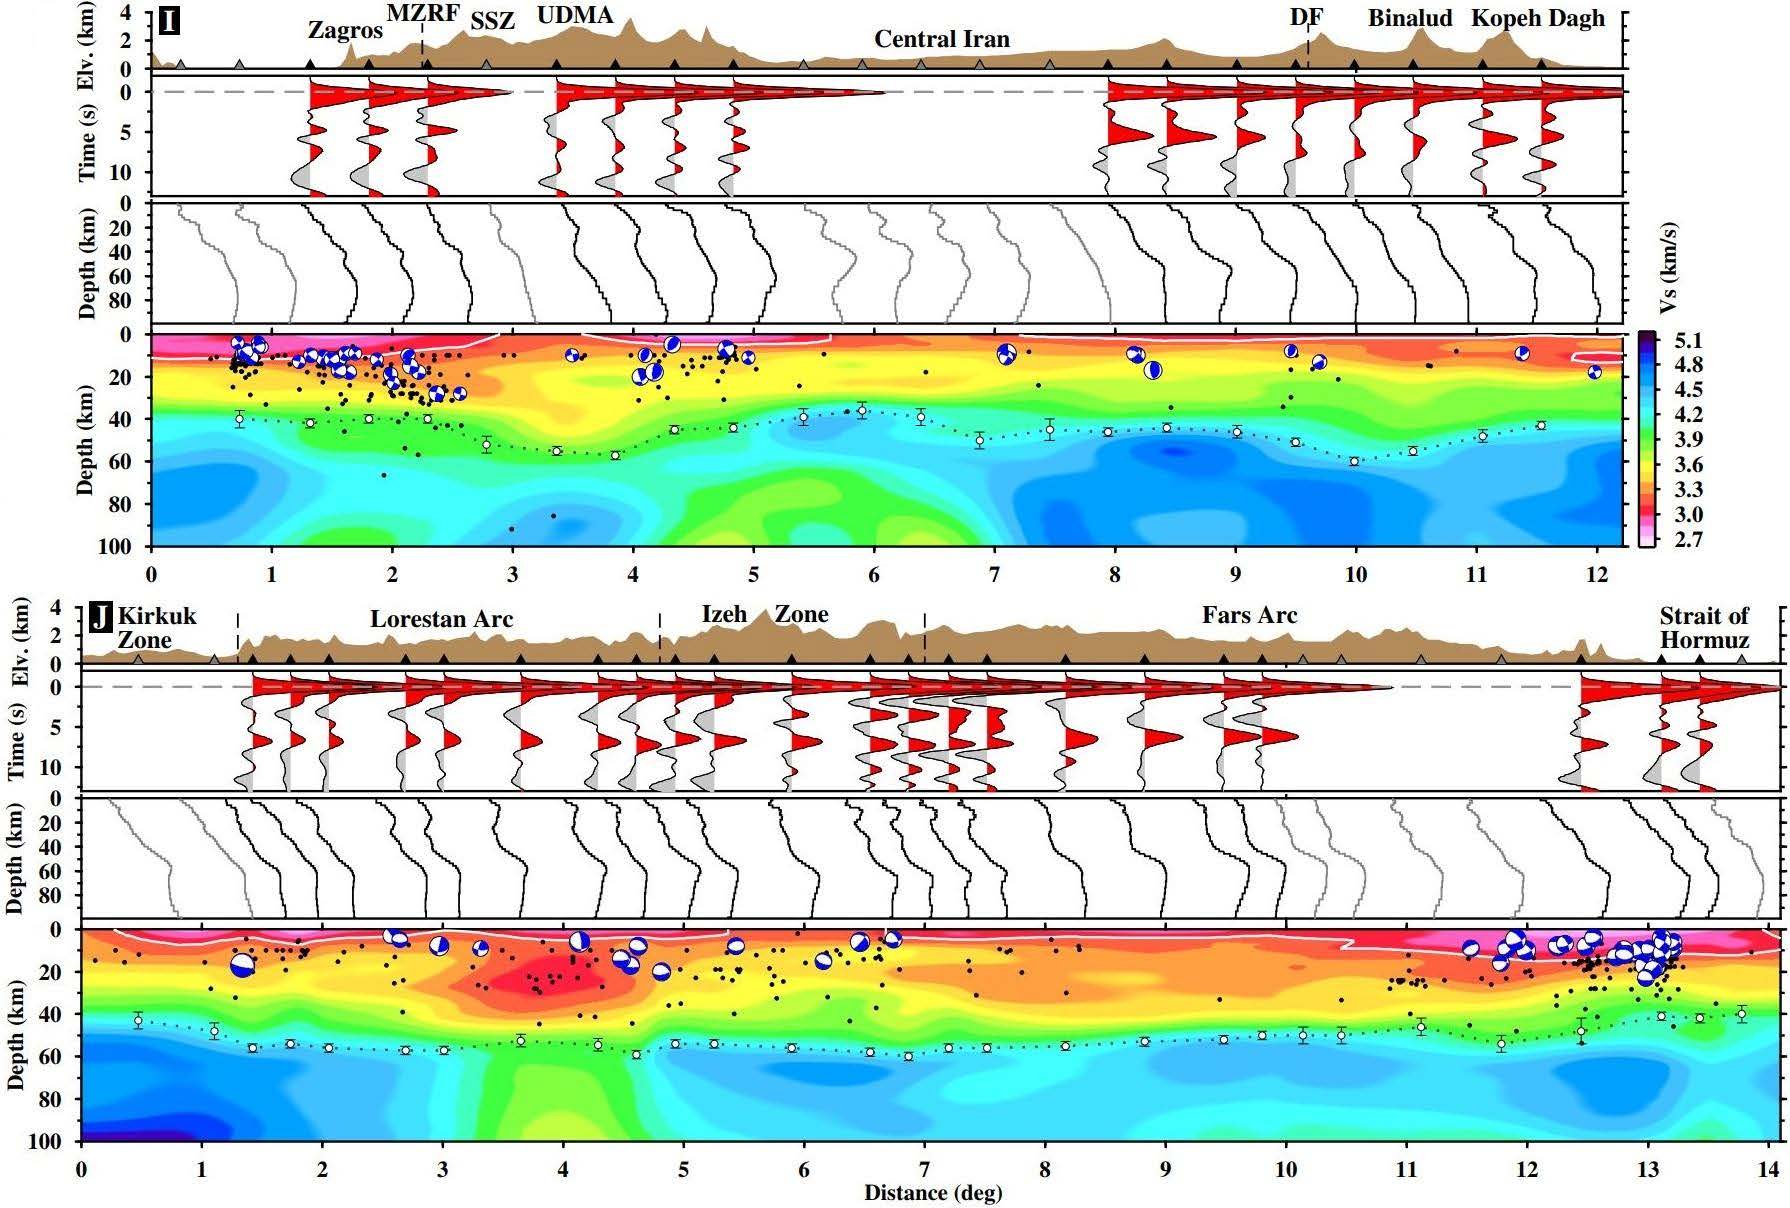
| Short Description | IPcrust2022 is a two-dimensional shear-wave (Vs) model of the Iranian Plateau crust and uppermost mantle derived from a joint analysis of fundamental mode Rayleigh wave group velocities and P-wave receiver functions. The model covers an area from 39.25E, 45.25N in the northwest to 25.25E, 62.25N in the southeast and is contained in a single, gzipped file consisting of seven columns — latitude and longitude in degrees, elevation in kilometers, Moho and Moho depth error in kilometers, and upper crustal, lower crustal and uppermost mantle Vs in km/s. At the boundaries IPcrust2022 is blended into CRUST1.0. The thickest crust (>55 km) is located beneath the Sanandaj-Sirjan Zone (SSZ) and the deforming belts of the Alborz-Binalud-Kopet Dag Mountains. Regions of lower topography/deformation (e.g., central Iran and the Lut Block), and the regions of younger deformation such as the Makran Accretionary Wedge (MAW) and the Zagros Simply Folded Belt (SFB) have a thinner (<45 km) crust. There is a low-Vs, tongue-shaped feature extending from the upper crust of the Zagros to the lower crust of the SSZ and Urumieh–Dokhtar Magmatic Arc (UDMA), suggesting an underthrusting of the Arabian crust beneath central Iran. In the central Zagros, the underthrusting of the Arabian crust is steeper, resulting in a narrower deforming zone (∼150 km) and a thicker crust (∼60–65 km), compared to the NW or SE Zagros where the deforming zone is broader (∼250 km) and the crust is thinner (∼55–60 km). Regions of low Vs in the upper crust correspond to regions of thick sediments: the South Caspian Basin, the Zagros SFB and Foreland Basin, and the MAW. The subcrustal Rayleigh wave azimuthal anisotropy of the Plateau shows a rather uniform and smoothly-varying pattern. In the NW Zagros, the crustal and subcrustal pattern of anisotropy agrees with that previously estimated from the shear-wave core phases, implying that the whole lithosphere deforms coherently, but for other regions (e.g., the western Alborz and Kopet Dag), the anisotropic pattern does not support a coherent deformational fabric throughout the lithosphere. |
| Authors: | Mohsen A. Irandoust, Department of Earth Sciences Institute for Advanced Studies in Basic Sciences (IASBS), Zanjan, Iran Keith Priestley, Bullard Laboratories Department of Earth Sciences University of Cambridge, Cambridge, United Kingdom Farhad Sobouti, Department of Earth Sciences Institute for Advanced Studies in Basic Sciences (IASBS), Zanjan, Iran |
| Reference Model | None |
| Prior Model | None |
| Model Home Page | https://www.esc.cam.ac.uk/directory/keith-priestley |
| Model Download | IPCRUST.2022.r0.0.nc (see metadata) is the model with topography in netCDF 3 Classic format. |
| Depth Coverage | crust and sub-moho mantle |
| Area | Iranian Plateau (latitude: 25.25° to 39.25°, longitude: 44.75° to 62.25°) |
| Data Set Description | Model IPcrust consists of the crust and sub-Moho mantle shear-wave velocity (Vs) structure at 672 points on an equispaced, quarter degree by quarter degree geographic grid covering an area extending from 39.25E, 45.25N in the northwest to 25.25E, 62.25N in the southeast. Model IPcrust is contained in a single gzipped file consisting of, for each geographic point, seven values — latitude and longitude in degrees, elevation in kilometers, Moho and Moho depth error in kilometers, and upper crustal, lower crustal and uppermost mantle Vs in km/s. |


Citations and DOIs
To cite the original work behind this Earth model:
- Irandoust, M. A., Priestley, K., & Sobouti, F. (2022). High-resolution lithospheric structure of the Zagros collision zone and Iranian Plateau. Journal of Geophysical Research: Solid Earth, 127, e2022JB025009. https://doi.org/10.1029/2022JB025009
To cite IRIS DMC Data Products effort:
- Trabant, C., A. R. Hutko, M. Bahavar, R. Karstens, T. Ahern, and R. Aster (2012), Data Products at the IRIS DMC: Stepping Stones for Research and Other Applications, Seismological Research Letters, 83(5), 846–854, https://doi.org/10.1785/0220120032.
DOI for this EMC webpage: https://doi.org/10.17611/dp/emc.2023.ipcrust2022
References
- G.C. Begg, W.L. Griffin, L.M. Natapov, Suzanne Y. O’Reilly, S.P. Grand, C.J. O’Neill, J.M.A. Hronsky, Y. Poudjom Djomani, C.J. Swain, T. Deen, P. Bowden; The lithospheric architecture of Africa: Seismic tomography, mantle petrology, and tectonic evolution. Geosphere 2009;; 5 (1): 23–50. https://doi.org/10.1130/GES00179.1
Credits
- r0.0 model provided by Model provided by Keith Priestley. netCDF format conversion by EarthScope.
Revision History
revision r0.0: uploaded July 27, 2023.
Timeline
- 2023-10-20
- r0.0 online


