Summary
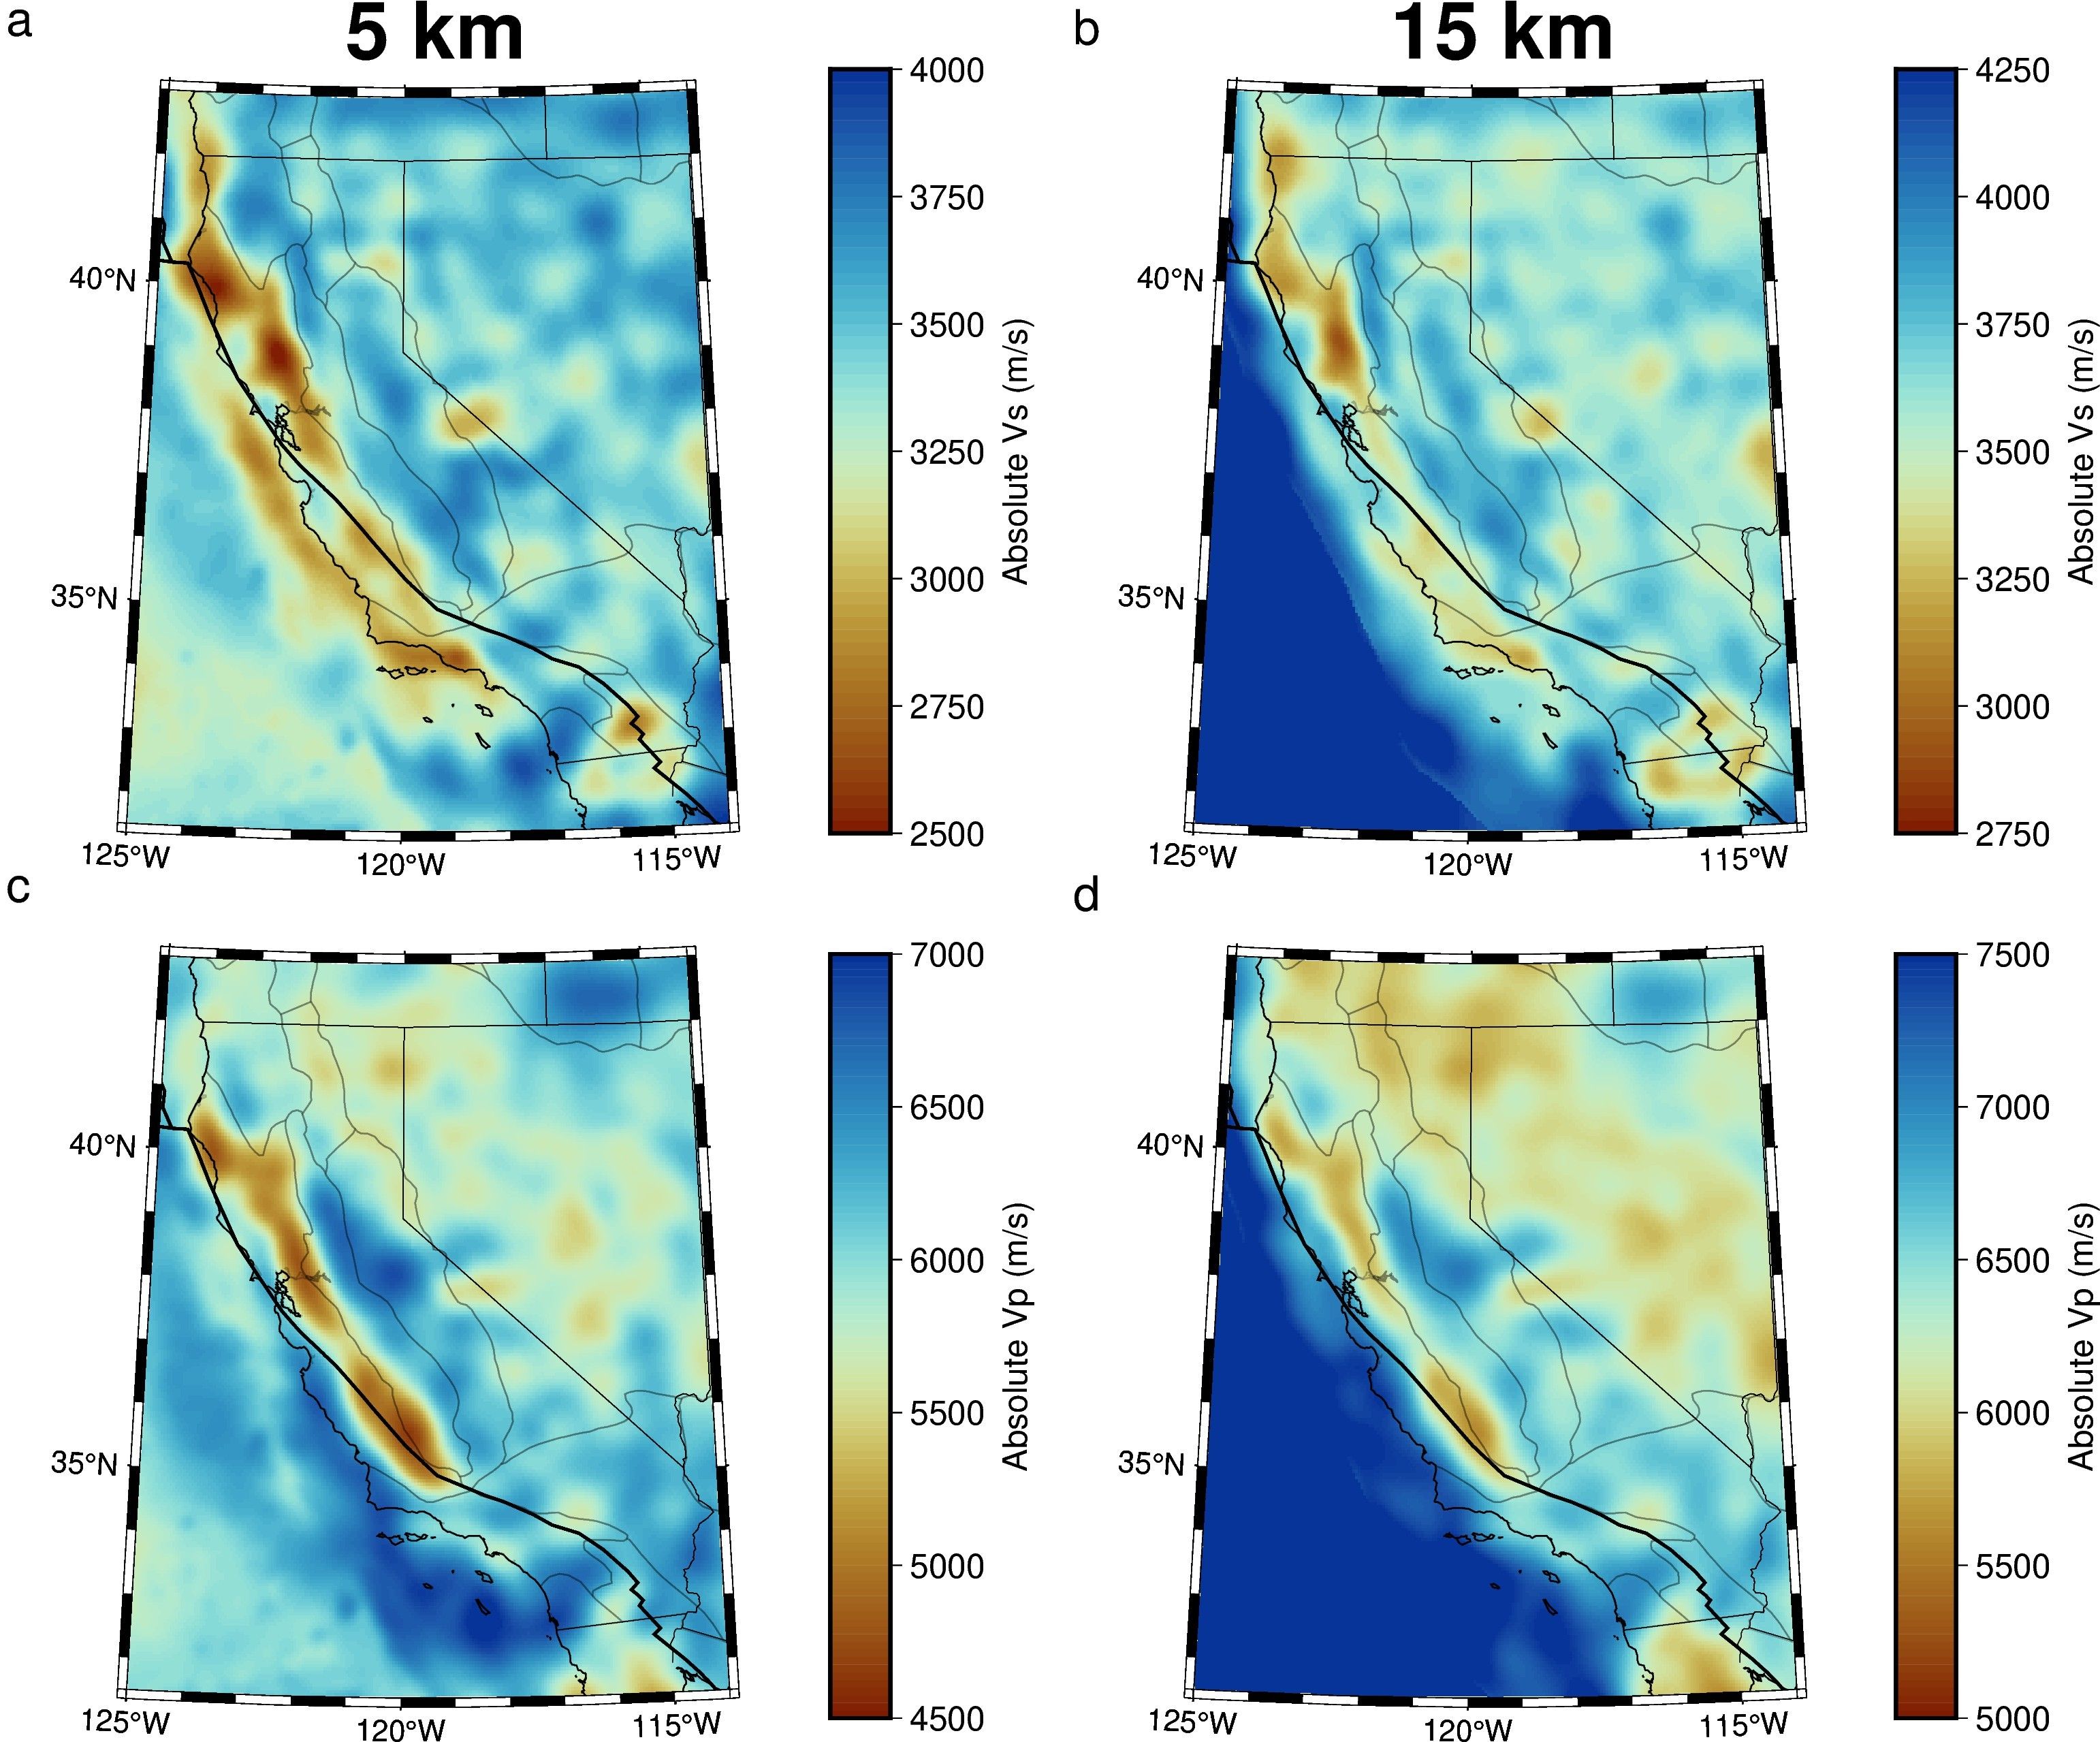
The California-Nevada Adjoint Simulations (CANVAS) model is a radially anisotropic adjoint waveform tomography model of the crust and uppermost mantle of California and Nevada.
Quicklinks
Description
| Name | CANVAS |
| Title | A radially anisotropic adjoint waveform tomography model of California and Nevada |
| Type | 3-D Tomography Earth Model |
| Sub Type | Full waveform model including wavespeed and density |
| Year | 2024 |
| Data Revision | r0.0 (revision history) |
| Short Description | The California-Nevada Adjoint Simulations (CANVAS) model is a radially anisotropic adjoint waveform tomography model of the crust and uppermost mantle of California and Nevada. The model follows a multiscale inversion approach where we begin with a period band of 30-100 seconds and iterate down to a minimum period of 12 seconds over 161 iterations. Data from over 30,000 source-receiver pairs are used across 117 events. The model honors the Moho topography of Crust1.0 (Laske et al., 2013). |
| Authors: | Claire Doody, Lawrence Livermore National Laboratory, Livermore, CA, USA Arthur Rodgers, Lawrence Livermore National Laboratory, Livermore, CA, USA Michael Afanasiev, Mondaic, Ltd., Zürich, Switzerland Christian Boehm, Mondaic, Ltd., Zürich, Switzerland Lion Krischer, Mondaic, Ltd., Zürich, Switzerland Andrea Chiang, Lawrence Livermore National Laboratory, Livermore, CA, USA Nathan Simmons, Lawrence Livermore National Laboratory, Livermore, CA, USA |
| Reference Model | None |
| Prior Model | WUS256 |
| Model Download | CANVAS.r0.0.nc (see metadata) is the model in netCDF 3 Classic format:
|
| Model Home Page | None |
| Depth Coverage | 0-100 km |
| Area | California and Nevada (31.5˚ /43˚ , -125˚ /-114˚ ) |
| Data Set Description | CANVAS was iteratively inverted to fit nearly 100,000 waveforms from 117 earthquakes over a period band of 12 to 100 seconds. |

Citations and DOIs
To cite the original work behind this Earth model:
- Doody, C., Rodgers, A., Afanasiev, M., Boehm, C., Krischer, L., Chiang, A., & Simmons, N. (2023). CANVAS: An adjoint waveform tomography model of California and Nevada. Journal of Geophysical Research: Solid Earth, 128(12). https://doi.org/10.1029/2023JB027583
- Doody, C. (2023). CANVAS: An adjoint waveform tomography model of California and Nevada [Dataset]. Zenodo. https://doi.org/10.5281/zenodo.8415562
To cite IRIS DMC Data Products effort:
- Trabant, C., A. R. Hutko, M. Bahavar, R. Karstens, T. Ahern, and R. Aster (2012), Data Products at the IRIS DMC: Stepping Stones for Research and Other Applications, Seismological Research Letters, 83(5), 846–854, https://doi.org/10.1785/0220120032.
DOI for this EMC webpage: https://doi.org/10.17611/dp/emc.2024.canvas.1
References:
- Fenneman, N.M. and Johnson, D.W., 1946, Physiographic divisions of the conterminous U. S: U.S. Geological Survey data release, https://doi.org/
https://doi.org/10.5066/P9B1S3K8
- Laske, G., Masters., G., Ma, Z. and Pasyanos, M., Update on CRUST1.0 – A 1-degree Global Model of Earth’s Crust, Geophys. Res. Abstracts, 15, Abstract EGU2013-2658, 2013.
Credits
- r0.0 model provided by Claire Doody.
Revision History
revision r0.0: uploaded January 17, 2024.


