Summary
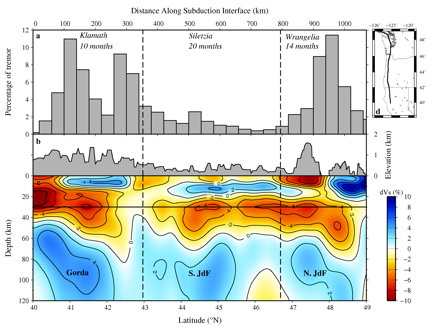
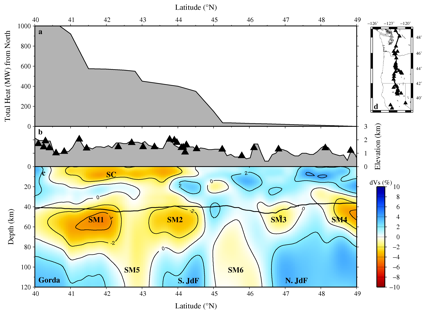
PNW10-S, Porritt et al. (2011) , PNW10-S combines the state of the art ambient noise tomography method with time tested analyst selection to ensure the highest quality data is used as input to the model inversion. Incorporating spatially and temporally long paths with this manual selection step allows recoverable structure from the surface to ~120km depth. This model focuses on the US Pacific Northwest to address a series of questions relating to variations in arc volcanism, seismicity, tremor activity, and the relation to subduction complex structure.
Quicklinks
Description
| Name | PNW10-S |
| Title | S-velocity model of the Cascadia Subduction Zone using Ambient Seismic Noise Tomography |
| Type | 3-D Tomography Earth Model |
| Sub Type | S velocity perturbation (%) and S velocity (km/s) |
| Year | 2010 |
| Short Description | S-velocity model of the Cascadia Subduction Zone using Ambient Seismic Noise Tomography. PNW10-S combines the state of the art ambient noise tomography method with time tested analyst selection to ensure the highest quality data is used as input to the model inversion. Incorporating spatially and temporally long paths with this manual selection step allows recoverable structure from the surface to ~120km depth. This model focuses on the US Pacific Northwest to address a series of questions relating to variations in arc volcanism, seismicity, tremor activity, and the relation to subduction complex structure. |
| Authors: | |
| Robert W. Porritt | |
| Department of Earth and Planetary Science | |
| University of California, Berkeley | |
| California, USA | |
| Richard M. Allen | |
| Department of Earth and Planetary Science | |
| University of California, Berkeley | |
| California, USA | |
| Devin C. Boyarko | |
| Department of Geology | |
| Miami University | |
| Ohio, USA | |
| Michael R. Brudzinski | |
| Department of Geology | |
| Miami University | |
| Ohio, USA | |
| Previous Model | |
| Reference Model | N/A |
| Model Download | |
| original model files from the model download page | |
| PNW10-S_percent.nc (see metadata ) & PNW10-S_kmps.nc (see metadata ), are the netCDF files for the model | |
| Model Homepage | http://seismo.berkeley.edu/~rallen/research/dna/pnw10 |
| Depth Coverage | 0 to 100 km |
| Area | Cross correlations span the entire US, with a handful of stations in Canada and Mexico. The inversion solves for relative structure from 33°N to 49.5°N latitude and 126°W to 110°W longitude, but we extract the well resolved section from 38.2°N to 49°N and 126°W to 119°W due to its data density. |
| Data Set Description | [ Porritt et al. (2011) ] While our dataset focuses on two Flexible Array Experiment (FACES and Mendocino Broadband) more than 1200 stations where used from the USArray transportable array, regional seismic networks, and temporary seismic deployments. Phase velocities measured from inter-station paths with a Frequency-Time Analysis procedure to prepare period dependent maps. |


Citations and DOIs
To cite the original work behind this Earth model:
- Porritt, R.W., R.M. Allen, D.C. Boyarko , and M.R. Brudzinski. 2011. “Investigation of Cascadia segmentation with ambient noise tomography.” Earth and Planetary Science Letters, 309(1-2), 67-76, ISSN 0012-821X, DOI:
https://doi.org/10.1016/j.epsl.2011.06.026 .
To cite IRIS DMC Data Products effort:
- Trabant, C., A. R. Hutko, M. Bahavar, R. Karstens, T. Ahern, and R. Aster (2012), Data Products at the IRIS DMC: Stepping Stones for Research and Other Applications, Seismological Research Letters, 83(5), 846–854, https://doi.org/10.1785/0220120032.
DOI for this EMC webpage:
References
- Audet, P., M.G. Bostock, D.C. Boyarko, M.R. Brudzinski, and R.M. Allen. 2010. “Slabmorphology in the Cascadia fore arc and its relation to episodic tremor and slip.” J. Geophys. Res. 115, B00A16. https://doi.org/10.1029/2008JB006053.
- Boyarko, D.C., and M.R. Brudzinski. 2010. Spatial and temporal patterns of nonvolcanic tremor along the southern Cascadia subduction zone.: J. Geophys. Res. 115:B00A22. https://doi.org/10.1029/2008JB006064.
- Brudzinski, M., and R.M. Allen. 2007. “Segmentation in episodic tremor and slip all along Cascadia.” Geology 35 (10), 907—910. https://doi.org/10.1130/G23740A.1.
- Ingebritsen, S.E. and R.H. Mariner. 2010. “Hydrothermal heat discharge in the Cascade Range, northwestern United States. J. Volcanol. Geotherm. Res. vol. 196 (Issues 3—4), 208—218. https://doi.org/10.1016/j.jvolgeores.2010.07.023 0377—273.
Credits
Model provided by Robert W. Porritt
Timeline
- 2012-02-06
- Online


