VASE is deprecated software. This manual is here for your information. If you are interested in the functionality that VASE provides, please use JWEED. Read the JWEED manual to learn more »
Updated: 2013-08-15 08:05 PDT
Name 
VASE – Viewer And Seismogram Extraction tool
Description 
Vase is a Java-based client application designed for viewing and extracting seismic waveforms from the DHI waveform repositories.
Download and Installation 
Vase is platform independent. When you download the application, Install Anywhere will install all the files as needed for your platform. No other action is required.
Please fill out the Vase software request form.
After submitting the form, Install Anywhere figures out what version would be best for your platform. Simply follow the instructions for your platform (on the download page). NOTICE: Mac users – must be running OS X or later.
General Usage 
Servers 
Vase’s opening screen presents you with a listing of Seismogram and Network servers grouped by institution. Scrollbars will appear as necessary to allow selecting servers which are not displayed. The column headed with SeismogramDC is the column which lists the waveform servers. The NetworkDC column lists servers for station information such as latitude and longitude.
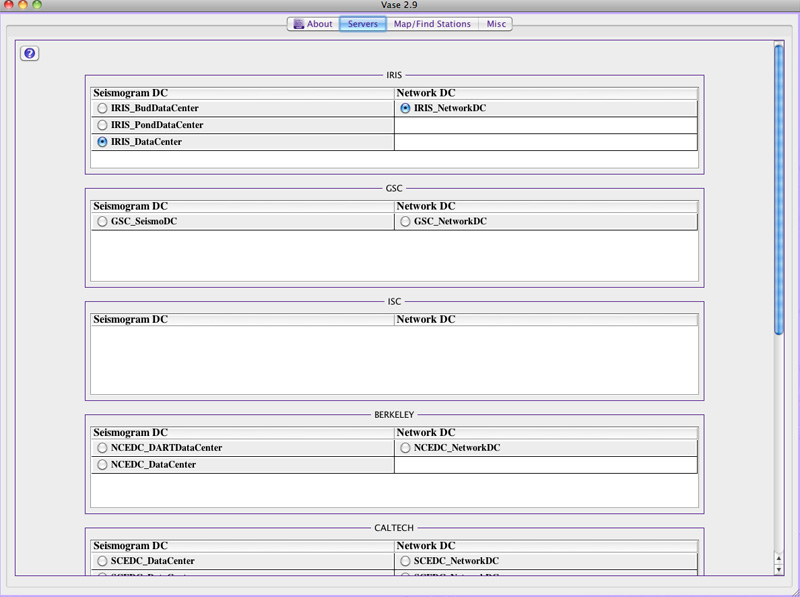
Which Seismogram Server To Use? 
IRIS Servers 
| BudDataCenter | Use the BudDataCenter for those stations which are streaming data to the DMC. There is approximately a 6 week moving window of data available in the bud. This varies slightly from station to station. Use this server if you want to have seismograms streaming onto your computer. |
| IrisDataCenter | This server has our most complete holdings. It holds the contents of the BudDataCenter along with our historical holdings. |
| PondDataCenter | This server accesses waveform data going back over ten years. This collection is obtained by gathering waveforms in a two hour window from earthquakes of magnitude 5 and above. Recent events are collected from the Bud, and as more stations report, their data is included. These older data sets have many more stations reporting than recent ones. |
Berkeley Servers 
| NCEDC_DataCenter | This server is similar to the Bud server. However the data starts at approximately 2001/10 and continues up to two days before the current day. Stations are located in Northern California and Southern Oregon. |
CalTech Servers 
| SCEDC_DataCenter | Similar to the BudDataCenter. This server will stream seismograms from stations located in Southern California. |
SC Servers: 
| SCEPPSeismogramDC | Similar to the BudDataCenter. This server will stream seismograms from stations located in South Carolina. |
Map/Find Stations 
Selecting the “Map/Find Stations” tab will display this screen:
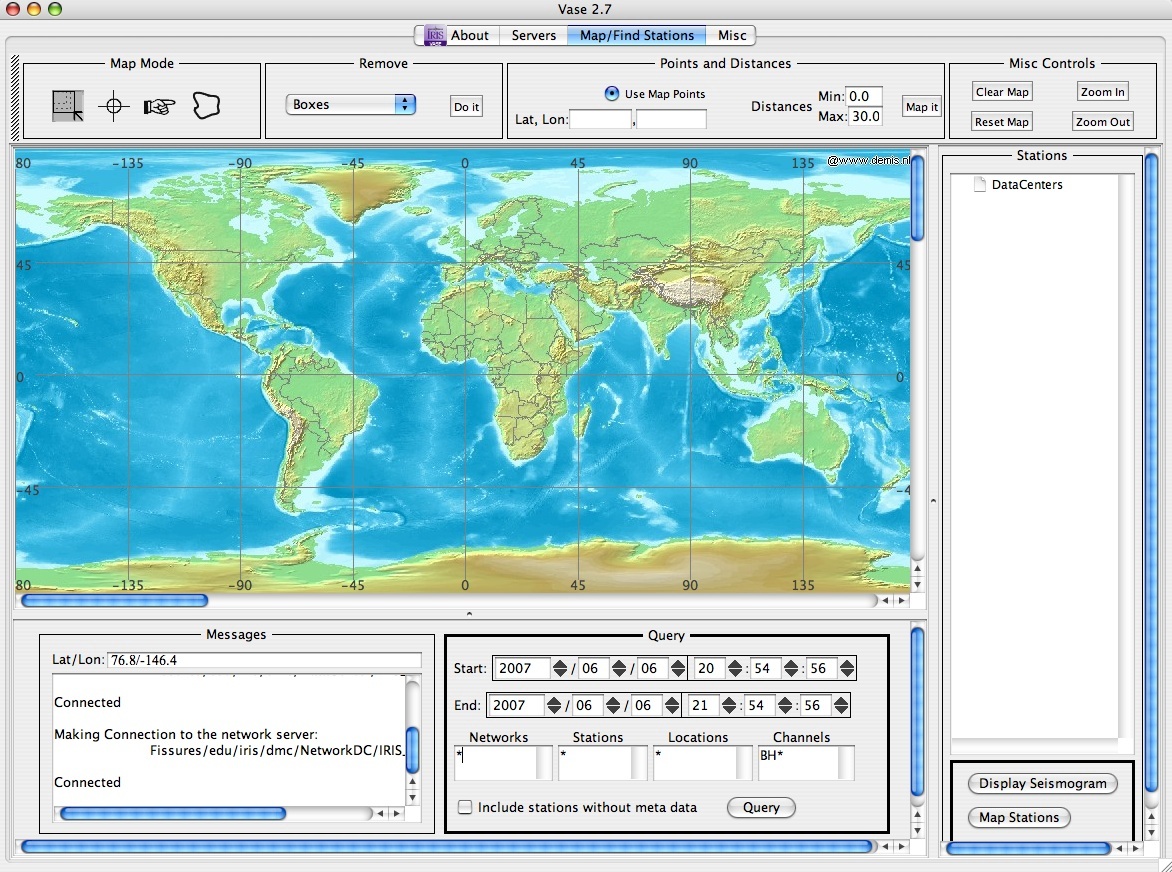
The top section holds the map controls. The four modes allow for drawing boxes, positioning points, selecting map items for
further processing, and for free hand drawing of arbitrary shapes.
Map Mode 
- Box drawing: this mode allows one or more rectangles to be drawn on the map. When querying the servers, stations will be limited to these boxes.
- Points mode: allows you to define one or more points. These points can be used to define a center point for finding stations within a distance. See Point and Distances.
- Shape mode: allows you to draw an arbitrary shape on the map. When querying for stations, the stations retrieved will be limited to these shapes.
The pointing finger can be used to select a particular rectangle, circle or shape for processing. The rectangle, shape or circle will be highlighted which indicates your selection. You click on the map somewhere inside the shape. Click again to deactivate. You can delete selected lat/lon boxes, shapes, circles or stations. Also when you pass this finger over a mapped station, the station information (station name, lat/lon) will be displayed in the “Messages” area.
Points and Distances 
You can generate distance on the map from user defined points (see above) or previously mapped stations. The default is to use the map points. You can define a minimum and a maximum distance. Circles will appear on the map. When querying stations, only stations with lat/lons within the distance circles are fetched.
Misc Controls 
- Clear Map will clear the map of all user entered edits, shapes, points, and stations.
- Zoom in will make the map larger. There are two ways to zoom in. If ou have one and only one lat/lon box drawn on the map, pressing the “Zoom In” button will zoom in on that area. If there is no lat/lon box defined, or more than one, clicking on this button will zoom in on the complete map as shown.
- Zoom out will make the map smaller.
- Reset map will bring back the original, whole world map.
Below the map are the user query inputs and message areas.
Messages 
As you pass over the map, the lat/lons are display in the text area provided. System messages, connection status, station information, error conditions, progress information, etc, are displayed in the scrolling area provided.
Query 
The query section allows you to load networks/stations. You can enter a start/end time, or specific networks, stations, locations and channels. You can use wildcard for a shortcut. To download continuously, use an endtime into the future.
Pressing Load Network will query the DHI for stations and channels which meet your criteria. It will further delimit the result by what is drawn on the map. It will only find stations which lie within the lat/lon, point/distance or freehand shape as drawn on the map.
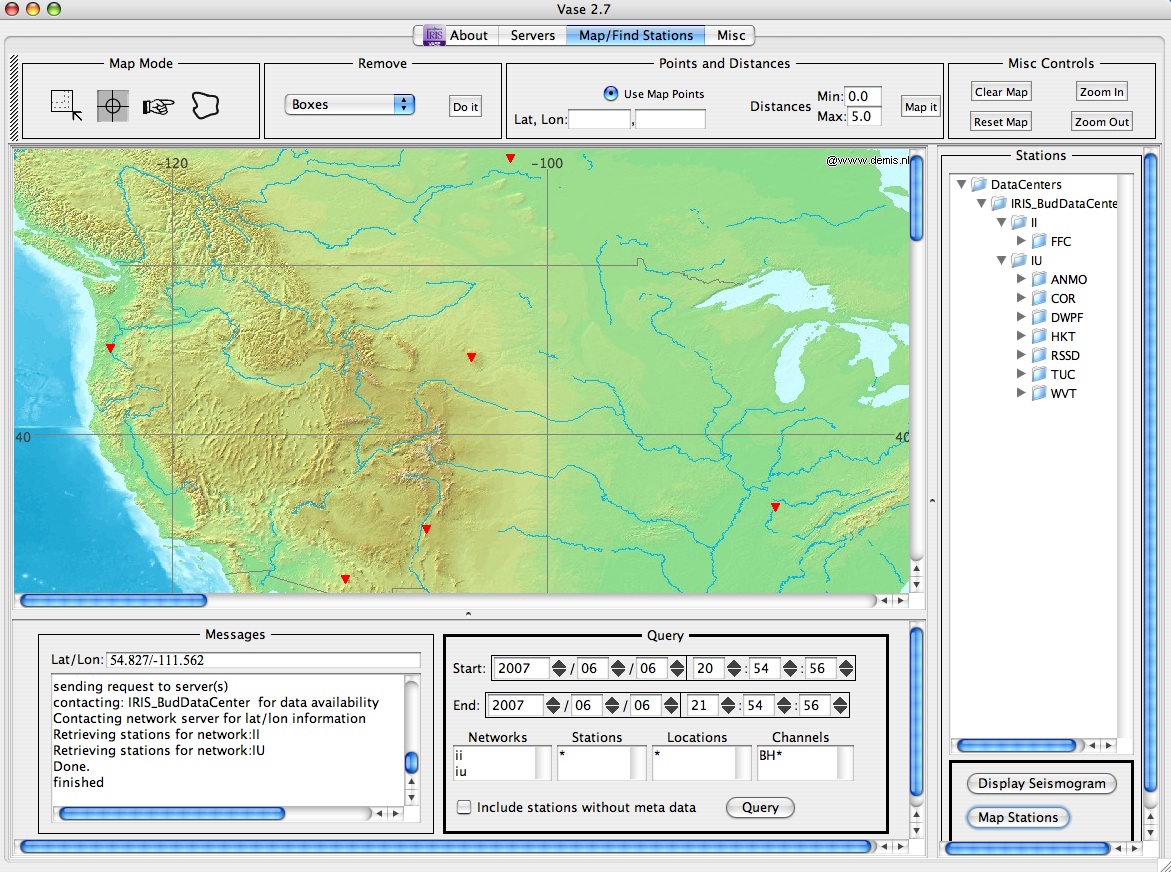
For this query I zoomed in on the US area using the lat/lon box drawing tool. Then I asked for networks II and IU.
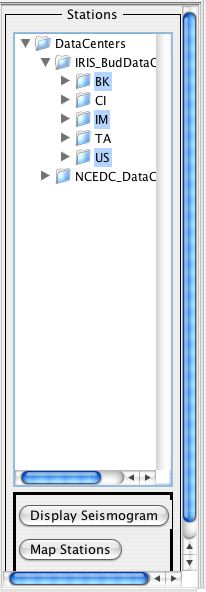
On the right is the query result. You can click on the triangle to expand the selection. You can select individual channels or select a station for all channels for that station. Similarly, you can select networks to display all stations and channels. And again you can click on a data center for all networks, station and channels.
You can select more than one of any item. The keyboard keys used to do this vary from PC to Mac to Linux. On the Mac you press down the Apple key while clicking on a network or station or channel. On a Windows and Linux machine it is <CTRL><ALT><mouse click> combo which will select multiple items.
Option 1:
Select individual or multiple stations/channels from one network.
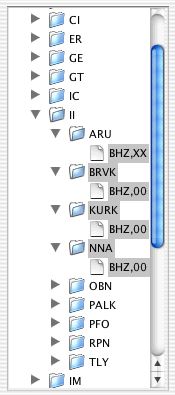
Option 2:
Select one or more networks.
Option 3:
Select multiple stations (all available channels) from multiple networks.

To map the stations, press the Map Stations button.
Displaying Seismograms 
To display the seismograms, press the Display Seismograms button. A new tabbed pane will appear with the download process initiated. If you have mapped any stations, Vase will use these as the basis for the download. If among the mapped stations you have any selected, Vase will use this subset. If you haven’t mapped any stations it will use the list described above. If from this list you have any selected, Vase will use these.
Each time you click on the “Display Seismogram” button a new tabbed pane will be created with the name “View Pane n” where “n” is an incrementing number. Here is View Pane 1:
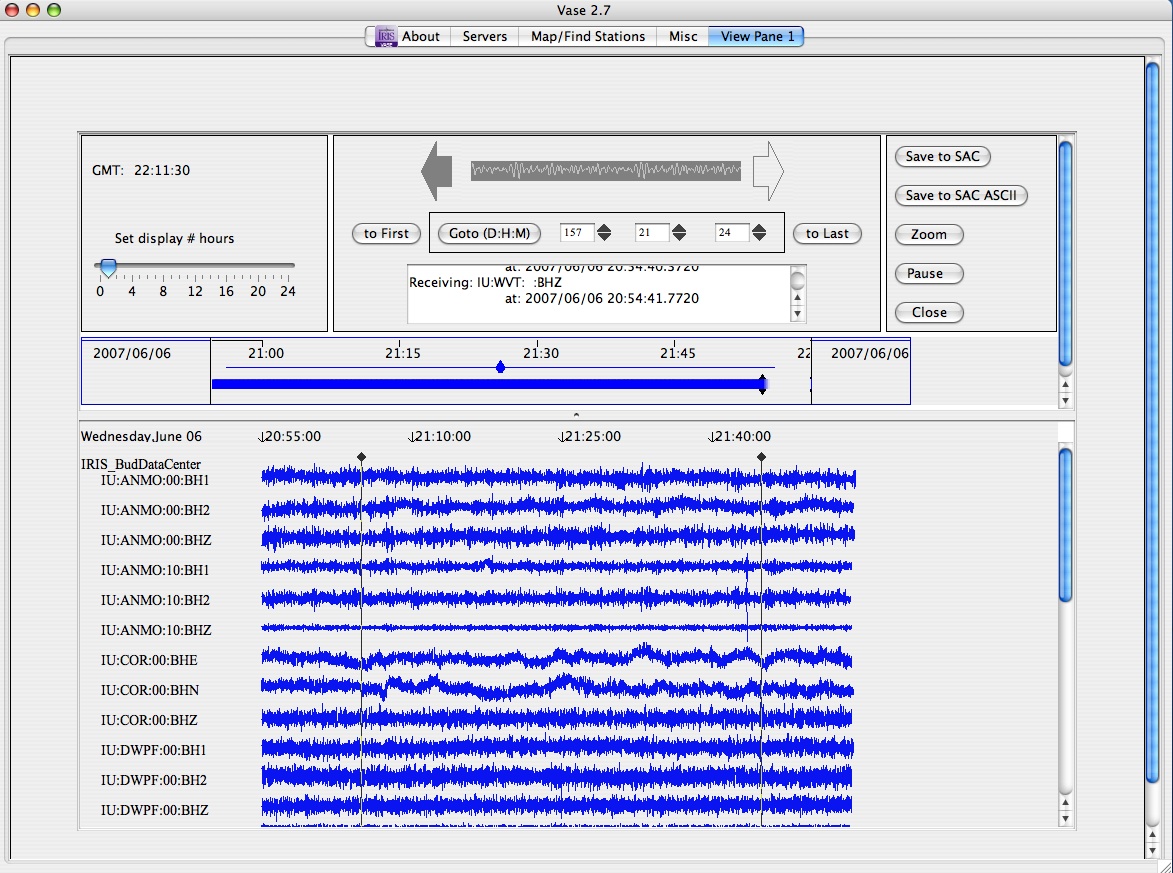
This screen is divided into 3 sections. Note that you can expand the seismogram display area by dragging the corner of the screen and also by dragging the divider bar located just above the seismogram waveforms.
The top section holds some information areas and also some control areas.

On the right, the current time is displayed along with a slider which allows for setting the displayed window’s time envelope.
In the center, are a left and right arrows which allow for paging through the downloaded data (assuming a long enough seismogram). It will page to whatever the window’s time envelope is set to. You can also jump to the beginning or end of the seismogram (to First or to Last buttons) or specify a specific time (Goto (D:H:M)).
The scrolling bar with a seismogram animation is an indicator that the program is receiving data. As data arrives the message to that effect is displayed in the listing.
To the right are some option buttons.
You can save to disk in either the SAC or SAC ASCII formats. The complete download will be saved. You can save all stations and channels or by clicking on the station/channel name select one or more for processing. The name will be highlighted in red indicating a selection. Here is a screen shot showing some traces individually selected:

You can individually select traces for saving to disk or zooming. After clicking on either the Save to Sac or the Save to SAC ASCII buttons, you are presented with a popup screen from which you can move around the directories on the local disk.
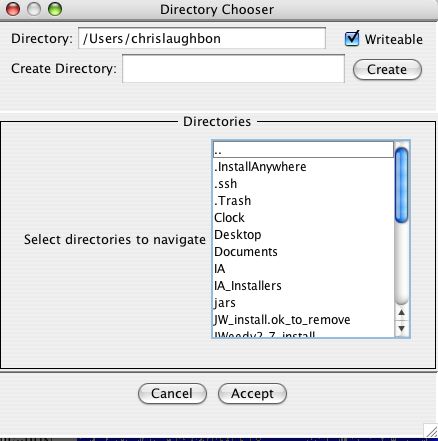
You can create directories and by clicking in the listing, move around the hard drive. Click on the .. entry to go up a level.
When you are in the appropriate directory press the Accept button. It will enter the appropriate station lat/lon and the overall gain into the SAC header.
When you click on the zoom button, another window pops up with a zoomed image of the original screen. To specify the time range of the zoomed waveforms, drag the black vertical bars left and right to the desired time envelope. Here, black bars are at about 22:35:03 and 22:53:03.
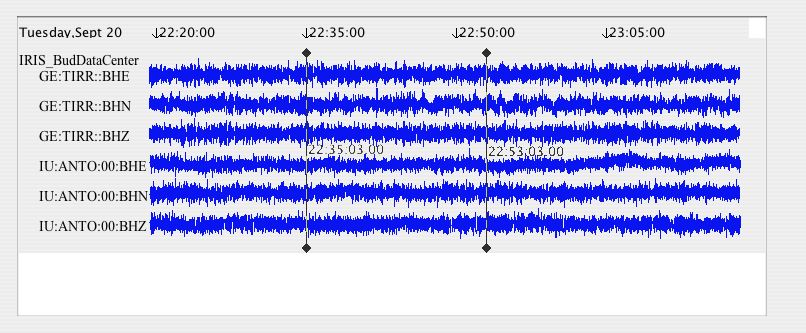
The zoom popup window will show this time window.
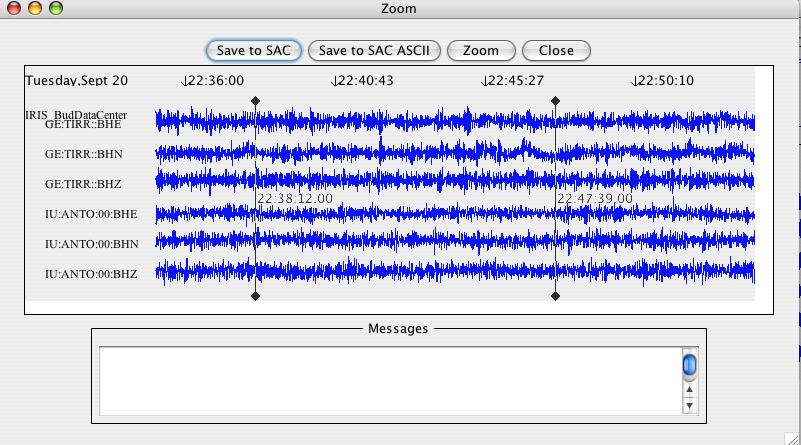
You can continue zooming in the same fashion. You can zoom all waveforms, or select one or more by clicking over the name. The name will be highlighted in red to indicate selection. You can save the individual waveforms to disk in the same way.
The Message Window will detail progress as you save the files. In between the top area and the seismogram display is this panel:

The purpose of this panel is to show the complete download process. If you download many hours of data, the seismogram display will only display the latest. This panel will show the complete time. The narrow bar with the diamond represents the time of the currently displayed area. You can click and drag this diamond to quickly move to another time. Here is a picture of a 10 hour download, with the last hour being displayed:

Notice the diamond bar is indicating a displayed time between the hours of 21 and 22:00 which matches the displayed seismograms. To go quickly to 12:00 you would drag the diamond to the 12:00 marker and release. The seismogram display will be updated.

Properties file 
With this release Vase makes use of a properties file called Vase.props. This file will be located in the directory into which you installed Vase. The purpose of the properties file is to hold program initialization variables. These variables include:
| home | enter a “home” directory which Vase will use for saving downloads. |
| enter an email for restricted license access | |
| password | enter a password for this license |
| map_server_online | enter “true” or “false” to indicate to Vase whether to use an online map server or the internal static map |
| map_server_base_name | enter a url base bame |
| map_color | specifies to Vase what color to use when drawing |
Different maps, because they may be light or dark, need a light or dark color to draw or else the drawing action won’t be seen.
View Screen Options 
The View Screen Options tab displays this screen:
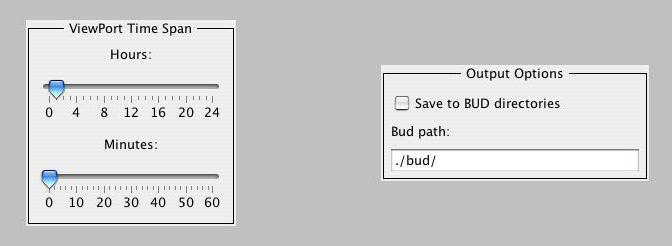
The ViewPort Time Span options let you specify the initial time envelope when displaying seismograms.
The Output Options let you save downloads to what is termed “Bud” directories. The Bud directory structure is a hierarchical structure which has a topmost level named bud. Underneath this are directories with the network names. Then under these are the station directories, then channel files which are grouped by day.
It will create this bud directory, in the Vase installation directory, unless you enter a new path in the Bud Path entry area.
Updates 
Version 2.9 
- Requires Java 1.6
- Uses new IRIS plotting engine.
- Supports large downloads of data.
- Expanded viewing area for plots.
Version 2.8 
- New features:
- Ability to edit program properties. addition of the “home” property to define Vase’s working directory
- Support for accessing restricted data.
- Response file downloading.
- MINISEED output.
- Extensive help screens.
- Time spans are added to the nslc listing. User can see what time spans are available.
- Support for time tears when saving waveforms to disk. When Vase detects a time tear it will create a new file.
- Small improvements and bug fixes:
- Map loads in background, quicker response.
- If first map fails to load, or zoom level is not supported, Vase will try second mapping service.
- More consistent mapping of stations with what is requested.
- Took out station editing from map.
- SAC and SAC_ASCII files had header variables fixed. Variables referring to events were made “N/A” as opposed to zero values.
- Added support for 32 bit compression when zooming.
- Support for very long data streams.
- The
Aboutpane can be place into its own popup window.
Version 2.7 
- Map now uses OGC mapping services for background and zoom capability.
- Search for all networks uses a coarser scan for faster return of stations.
- Implementation of restricted data access authentication – to be paired with updated DHI waveform data service.
- Vase icon included in application.
- An ‘about’ screen with user documentation on how to use Vase.
- Retrieval of real-time data automatic for end times equal to or greater than present time.
Contact Information 
Categories
Release date: Modified date:


