February 2010 M8.8 Chile Quake
February 27, 2010 (06:34:17 UTC)
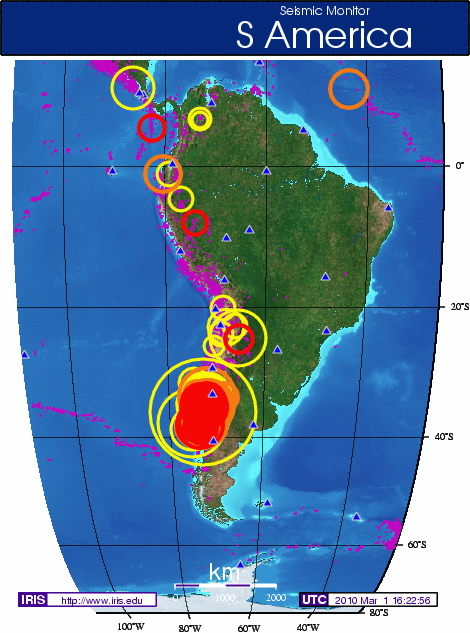
The M8.8 Chile earthquake of 27 Feb 2010, occurred at the boundary between the Nazca and South American tectonic plates. The two plates are converging at a rate of 80 mm per year. The earthquake occurred as thrust-faulting on the interface between the two plates, with the Nazca plate moving down and landward below the South American plate. Coastal Chile has a history of very large earthquakes. Since 1973, there have been 13 events of magnitude 7.0 or greater.
The location and magnitude was available via IRIS Seismic Monitor minutes after the earthquake was reported by USGS. The above map from March 1, displays several aftershocks in the region.
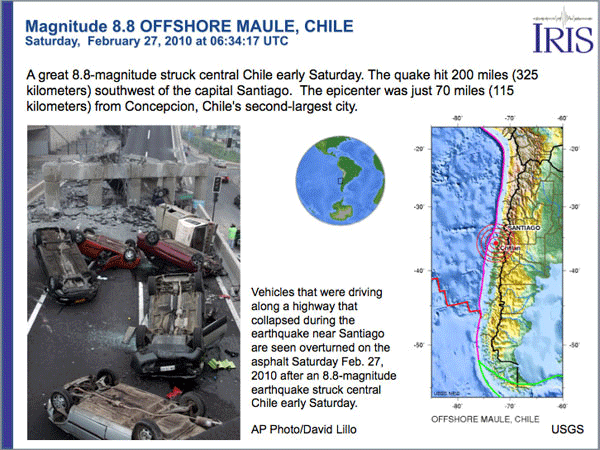
The magnitude 8.8 earthquake that struck Chile in 2010 was the strongest quake in the country since 1960. The initial earthquake drew thousands of visitors to the IRIS website and a lot of interest in the teachable moment information developed by IRIS Education and Outreach staff.
The Teachable Moment Presentations feature PowerPoint slides created in the first hours after the earthquake with information to use in middle school, high school or college classes. There is an IRIS Earthquake Notice in pdf format and a USArray Wave Visualization movie.
IRIS Community Instrument Deployment in Chile
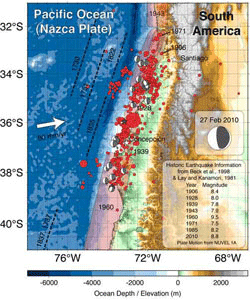
The National Science Foundation, using its Rapid Response Research (RAPID) funding mechanism, is supporting a project to collect an open community dataset from a portable seismograph deployment in an aftershock study following the magnitude 8.8 earthquake that occurred off the coast of Chile on February 27, 2010.
The IRIS Consortium, on behalf of its Member Institutions, will work with scientists from US universities and the University of Chile to deploy 60 broadband seismic instruments to record aftershocks for approximately six months. This community-wide coordinated approach will provide the best quality dataset that can be utilized immediately by a wide range of researchers from around the world. Read more.
Data via WILBUR
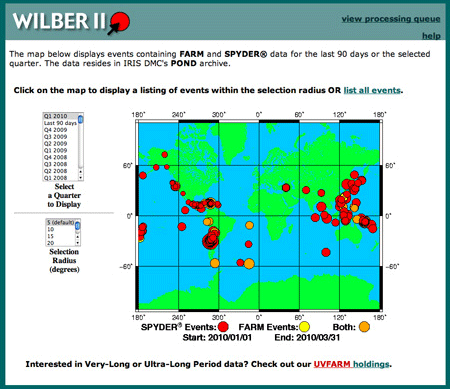
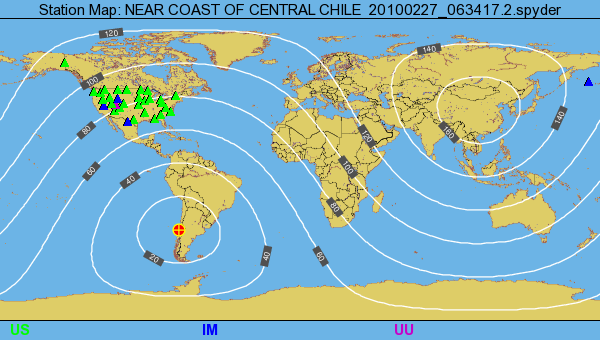
IRIS users accessed WILBER to generate station maps, build custom Record Section Plots and access seismic data.
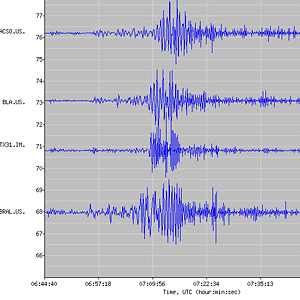
displays vertical displacements of the Earth’s surface recorded by seismometers
plotted with time (since the earthquake initiation) on the horizontal axis, and vertical
displacements of the Earth on the vertical axis. The traces are arranged by distance
from the epicenter in degrees.
Chile Waveform Data
Getting data using WILBER
| Data and Time | Source | Magnitude | Latitude | Longitude | Depth | Description |
|---|---|---|---|---|---|---|
| 2010/02/27 06:34:17.2 | SPYDER® | 8.3 | -35.83 | -72.67 | 59.40 | NEAR COAST OF CENTRAL CHILE |
(the preliminary M 8.3 number is automatically recorded in the database; the final magnitude value can change following review by seismologists; the Chile quake was adjusted to M 8.8)
BREQ_FAST request
Example of a BREQ_FAST request to obtain the most recent waveform data for this event.
.NAME your name
.EMAIL you@email.address
.LABEL GMV Event 3642289
.MEDIA FTP
.QUALITY B
.SOURCE ~NEIC NEICALRT~ ~ ~
.HYPO ~2010 02 27 06 34 17~-35.826~-72.669~59~8~135~NEAR COAST OF CENTRAL CHILE~
.MAGNITUDE ~8.3~MW~
.END
* _US-TA 2010 02 27 06 34 17 2010 02 27 09 49 17 1 LHZ
* _US-REF 2010 02 27 06 34 17 2010 02 27 09 49 17 1 LHZ
- Download the waveform data (SAC/SEED format)
- Chile Visualization Video (mp4)
Web Traffic
The initial M8.8 quake set a new record for visits to the IRIS website. (see graph comparing 2009 vs 2010).
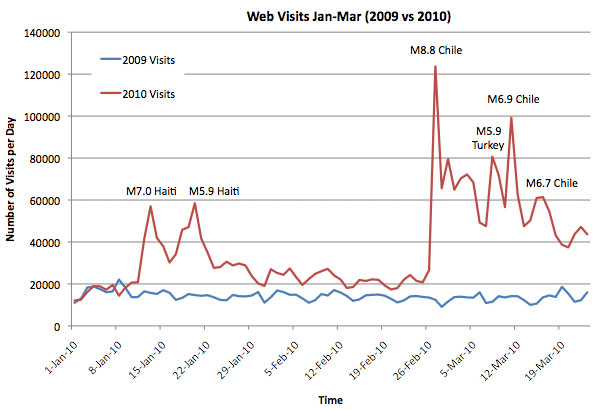
Web visits increased substantially in February-March 2010 due to the interest in the Chile earthquake. Starting Feb 27th, web traffic jumped over 895% compared with the previous year. Seismic Monitor had the most visitors in IRIS history. Compare with the web visits following the Haiti earthquake in January 2010 which had the previous record.
More information
by Tim Knight (IRIS Data Management Center)


