This Special Event web page is intended to provide direct links to and images of data and materials available from SAGE programs and preliminary research results from the seismology community. We welcome any additional contributions containing original content that might be of interest to the research community. Please send them to the email address listed below.
SAGE does not necessarily endorse the views or scientific validity of the posted items.
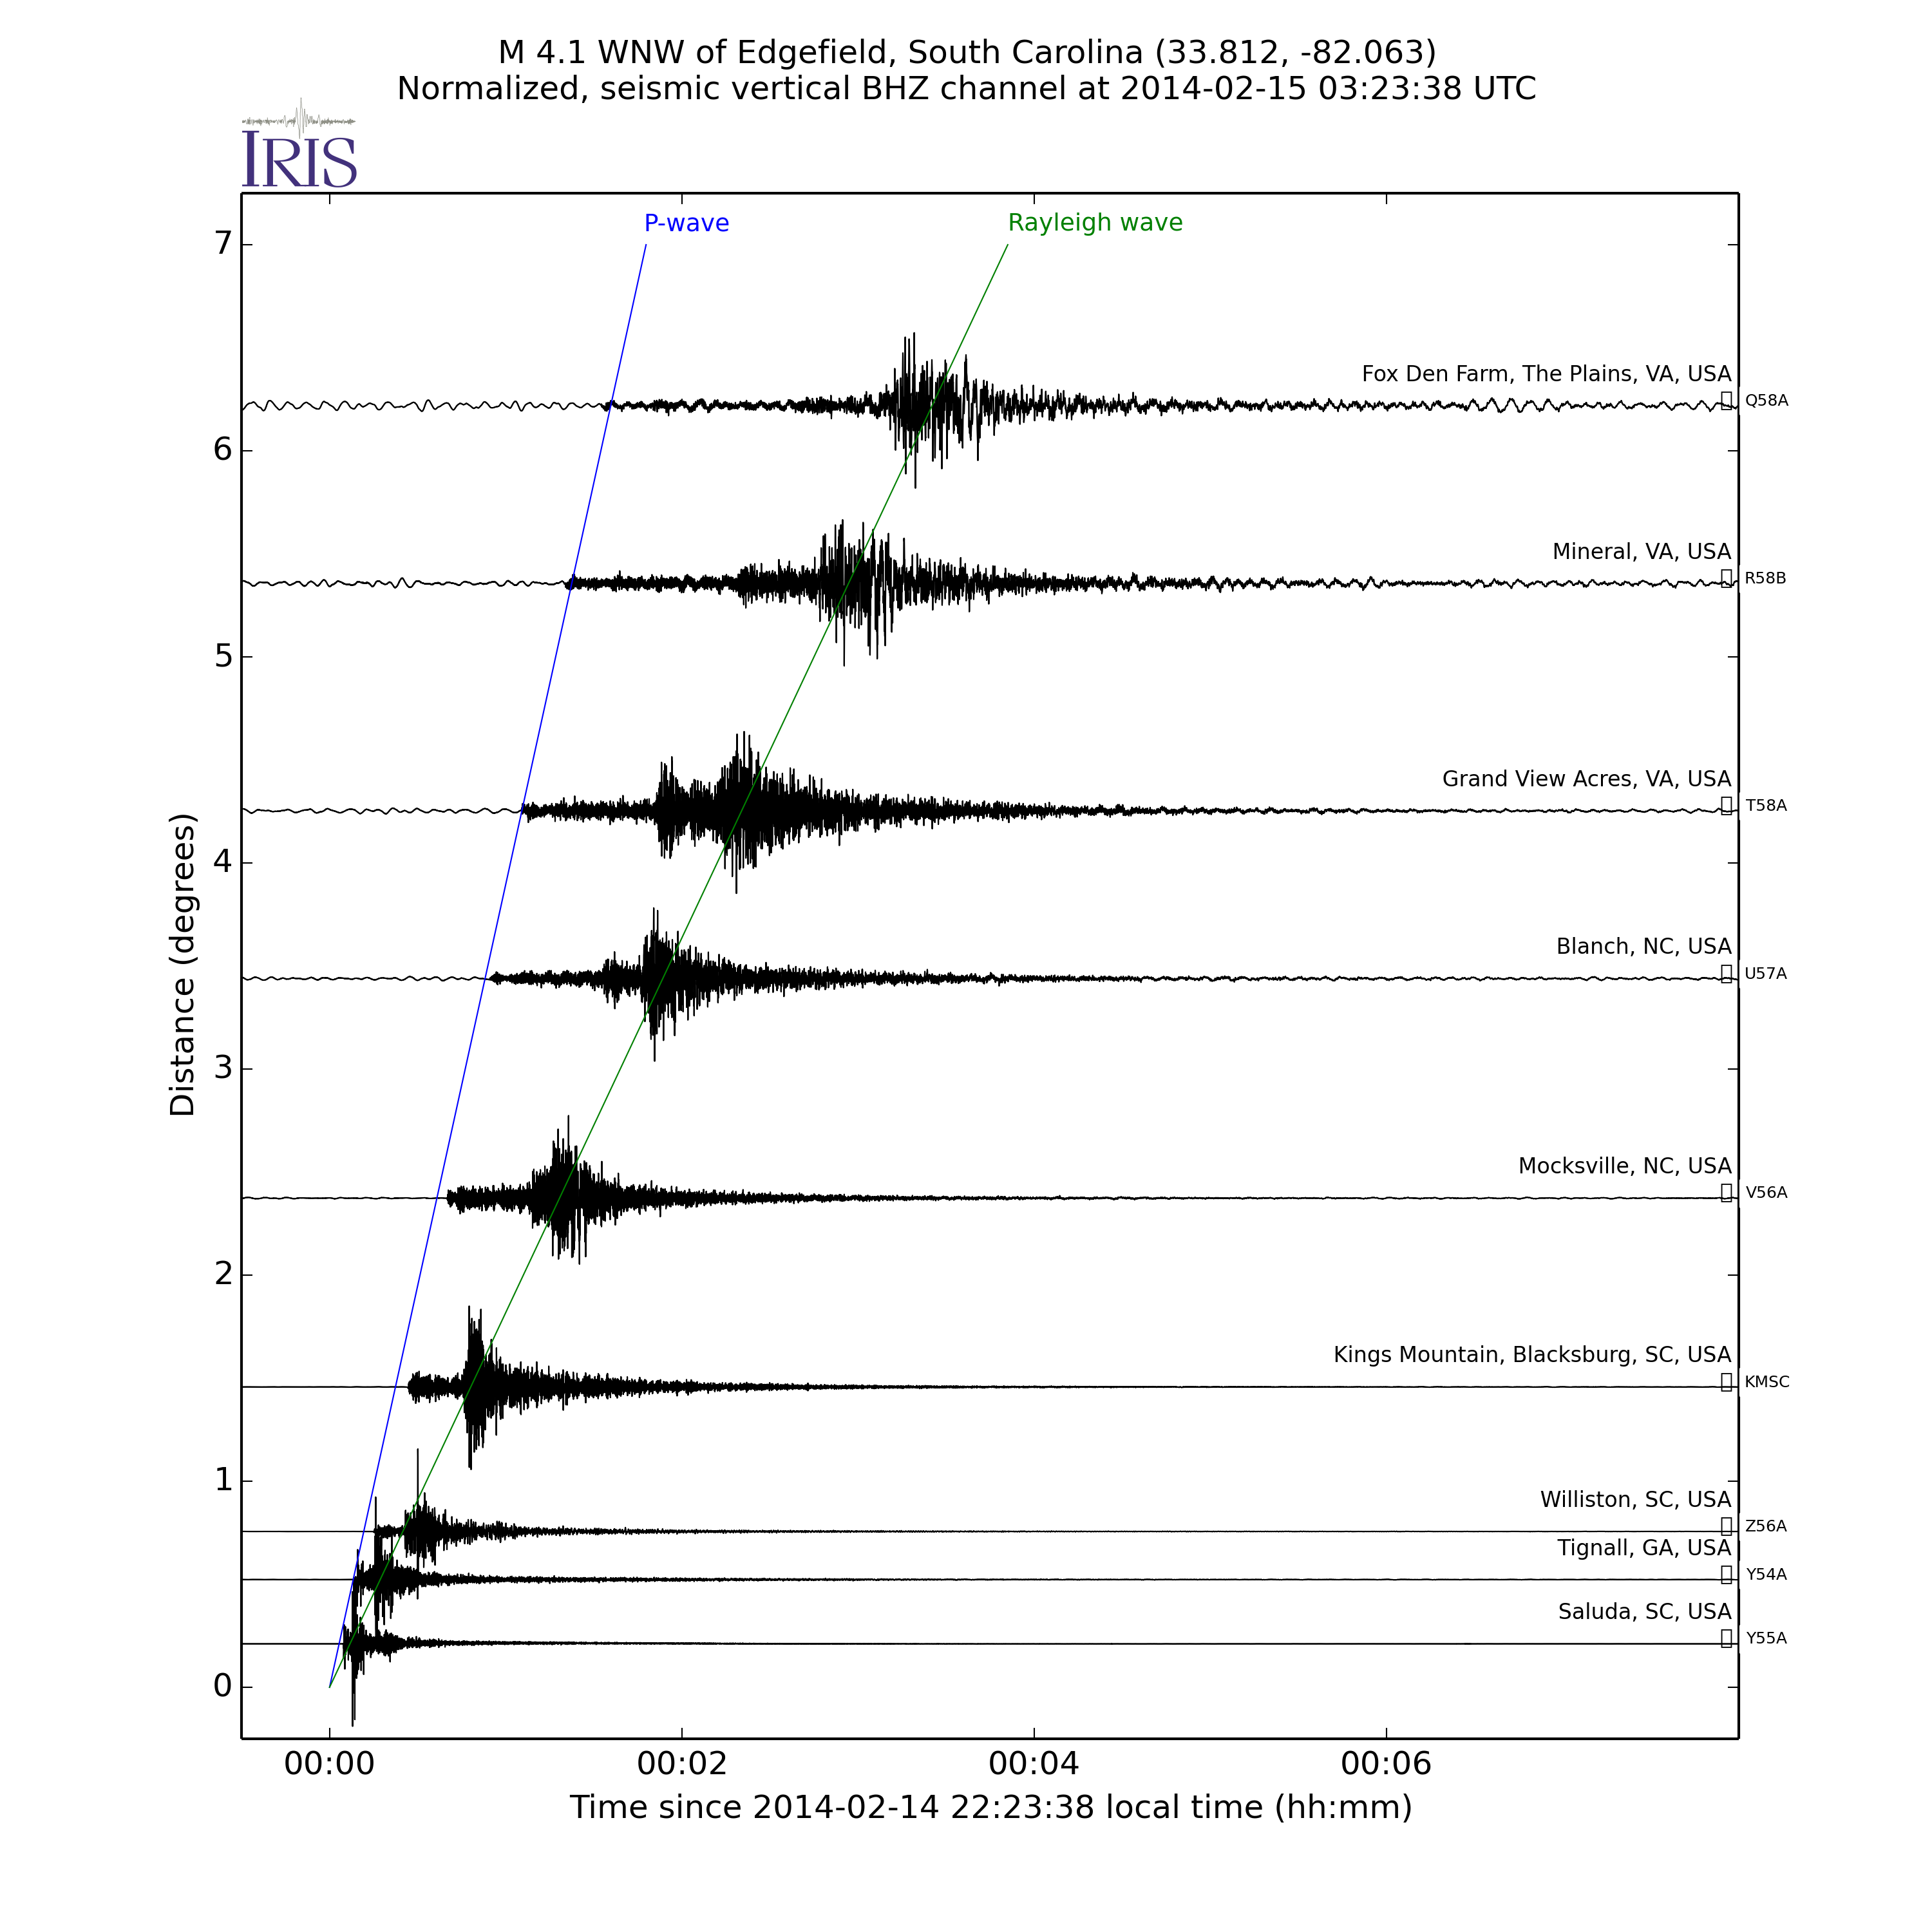
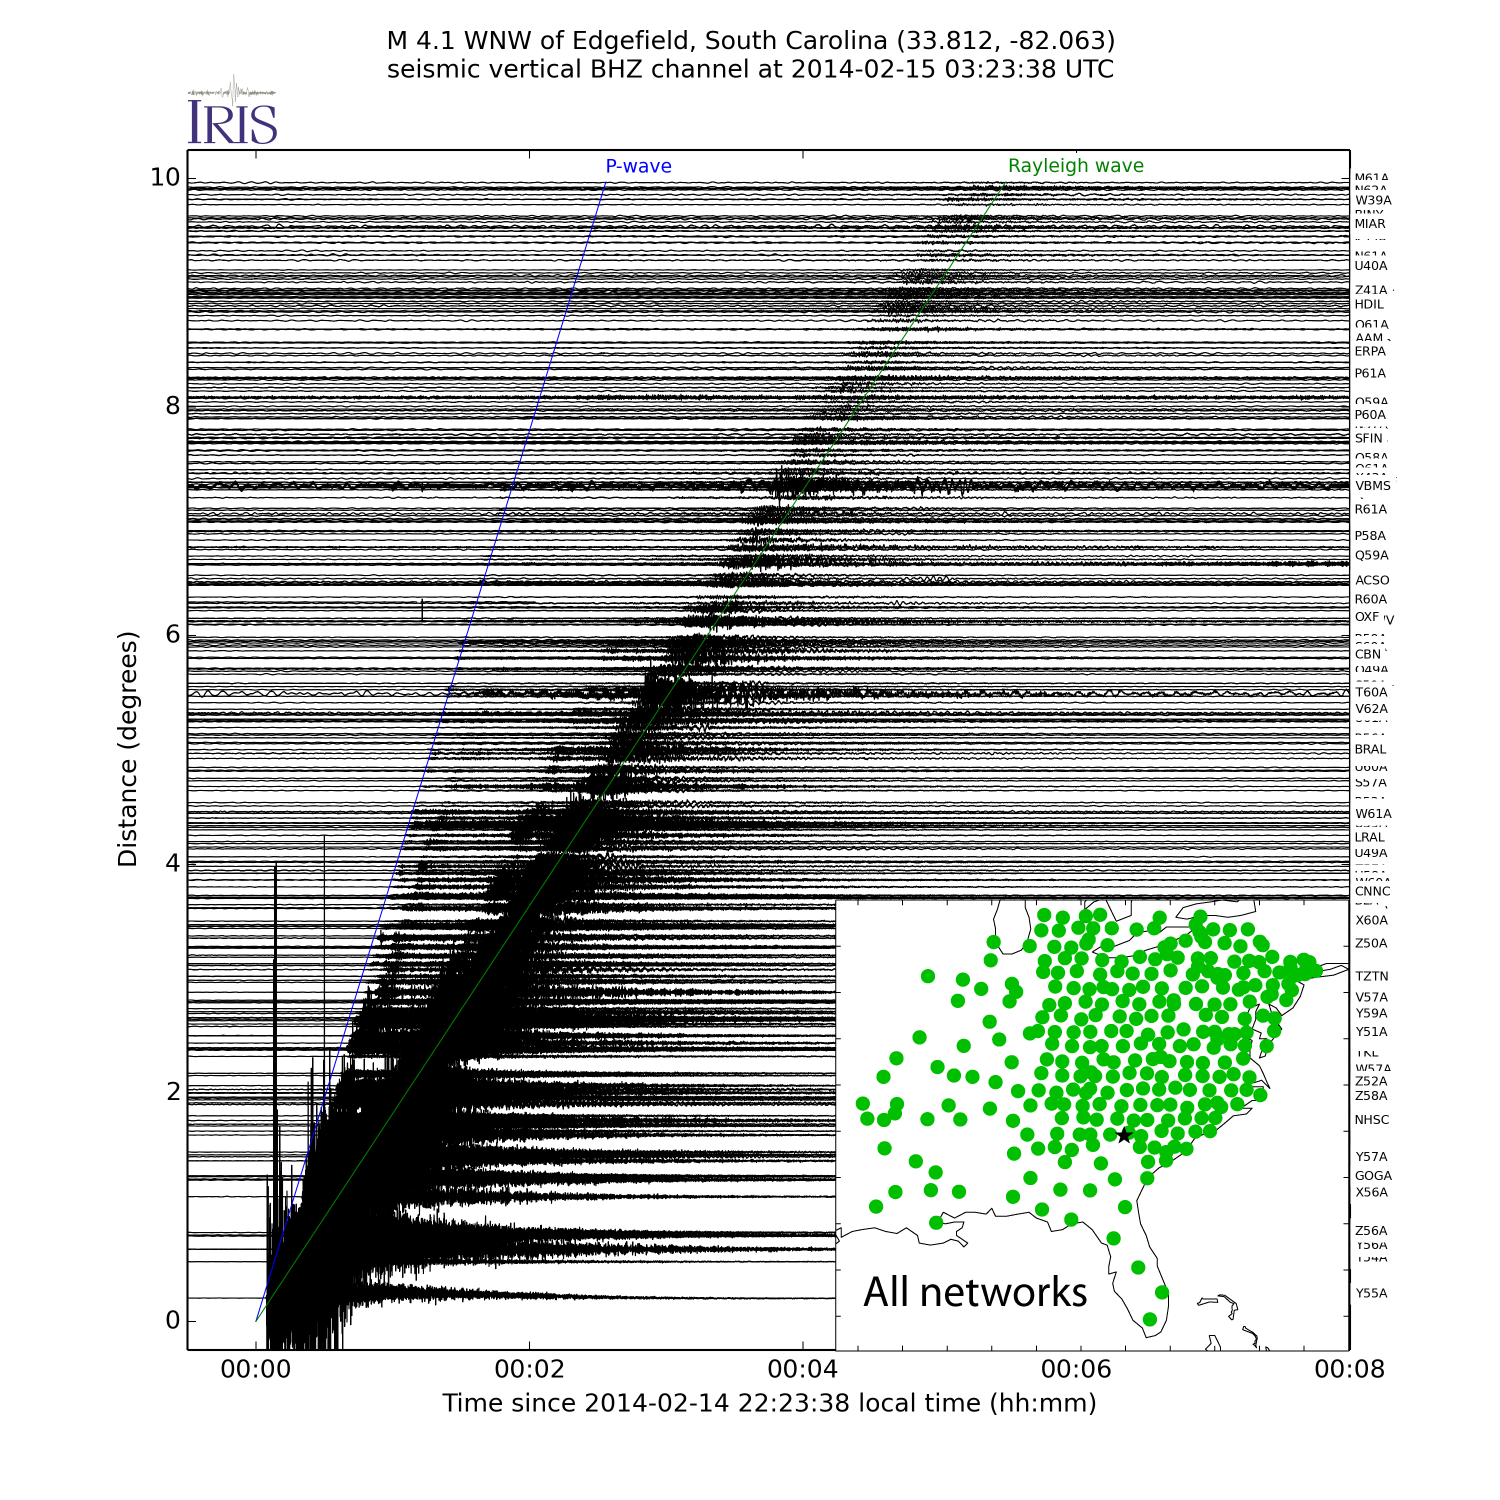
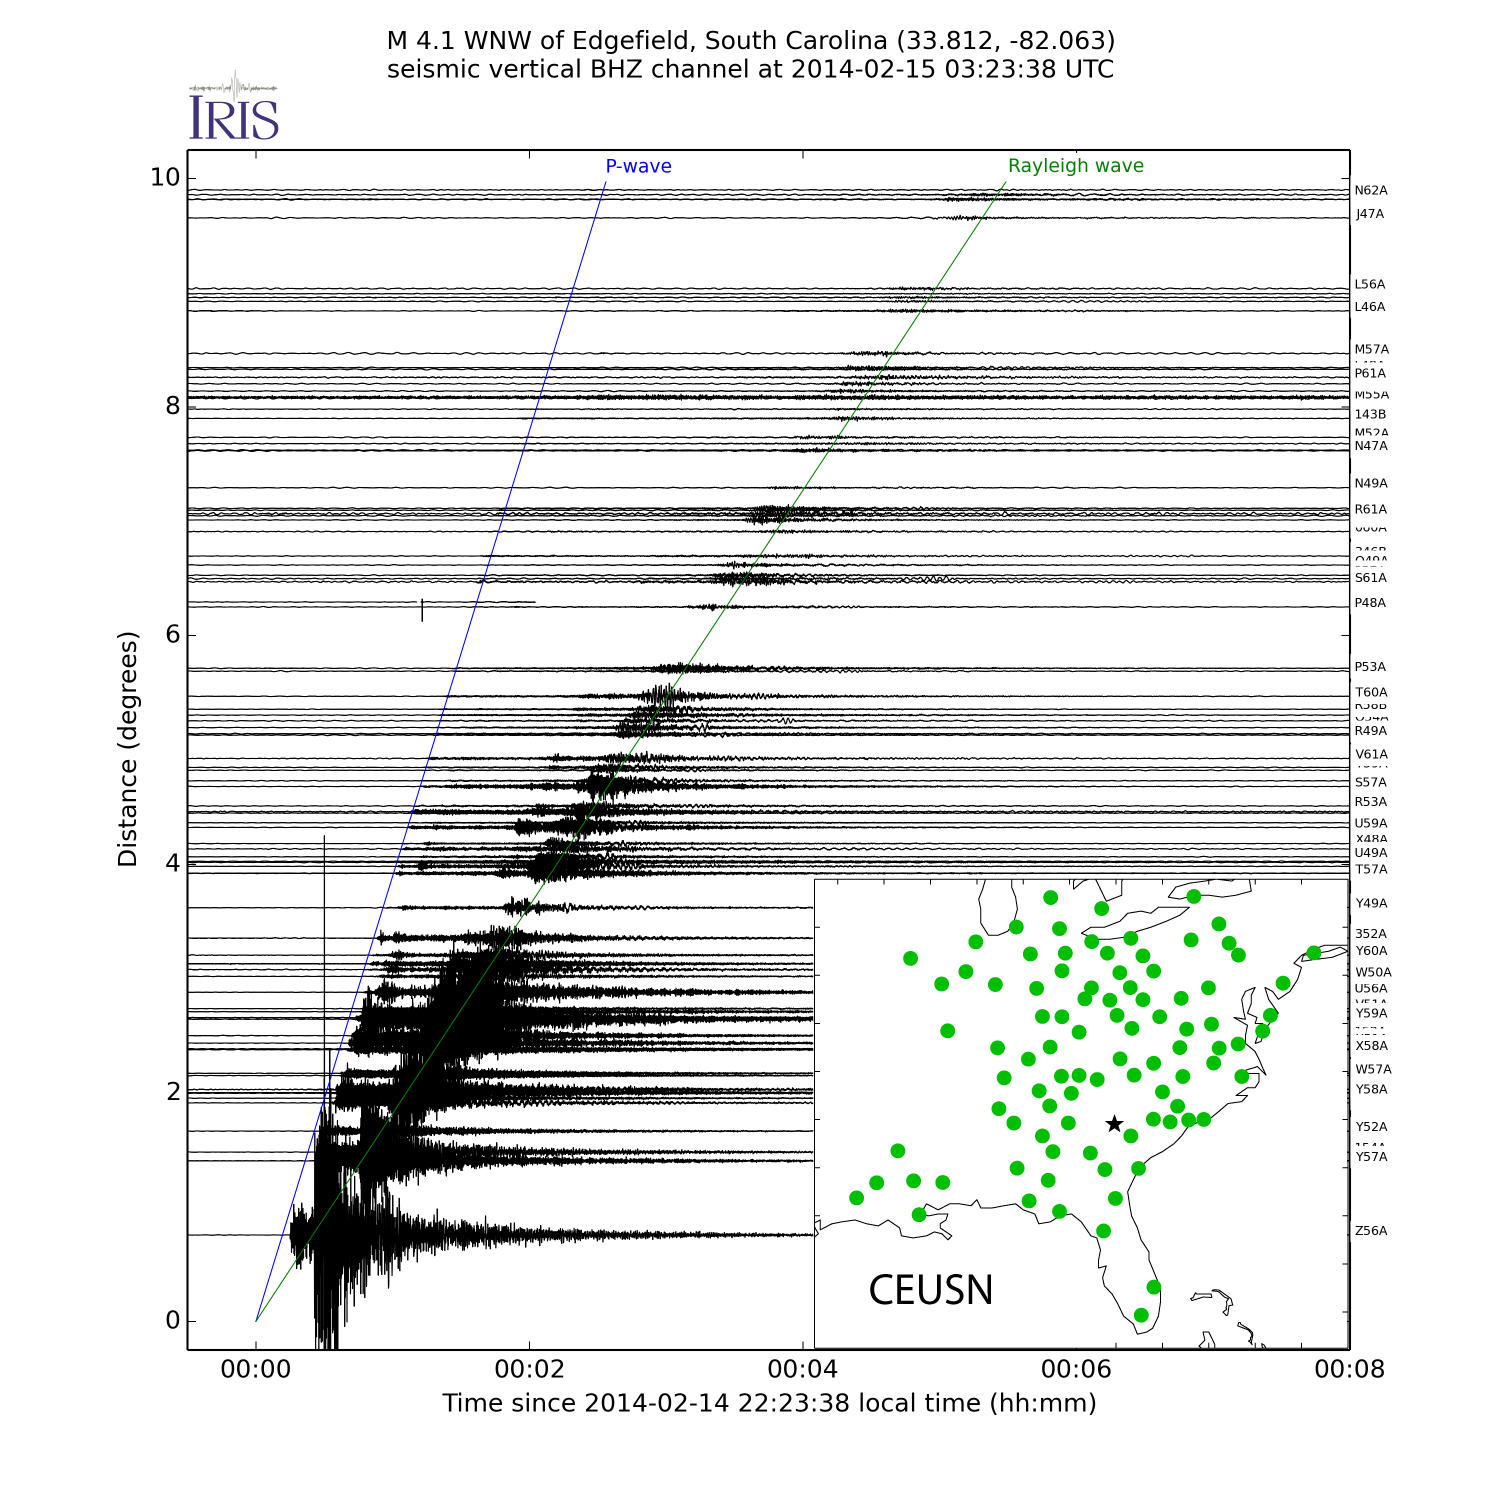
February 15, 2014 M4.1 earthquake in Edgefield, South Carolina
Email contributions to:
special-events@lists.ds.iris.edu
Note:
All scientific contributions addressed to the community will be forwarded to the special-events mailing list.
If you DO NOT want your email being forwarded, please address it to SAGE or explicitly write
do not forward.
Quick Links
Event parameters (from USGS)
Please check the USGS page for the latest official information.
| Magnitude | 4.1 |
|---|---|
| UTC Time | Saturday, February 15, 2013 at 03:23:38 UTC |
| Local Time | Friday, February 14, 2013 at 22:23:38 at epicenter |
| Location | 33.812°N, 82.063°W |
| Depth | 4.8km (3 miles) |
| Region | WNW of Edgefield, South Carolina |
| Distances | 12km (7mi) WNW of Edgefield, South Carolina 31km (19mi) NNE of Evans, Georgia 32km (20mi) N of Martinez, Georgia 35km (22mi) NNW of North Augusta, South Carolina 97km (60mi) WSW of Columbia, South Carolina |
Links 
Array Network Facility special event page

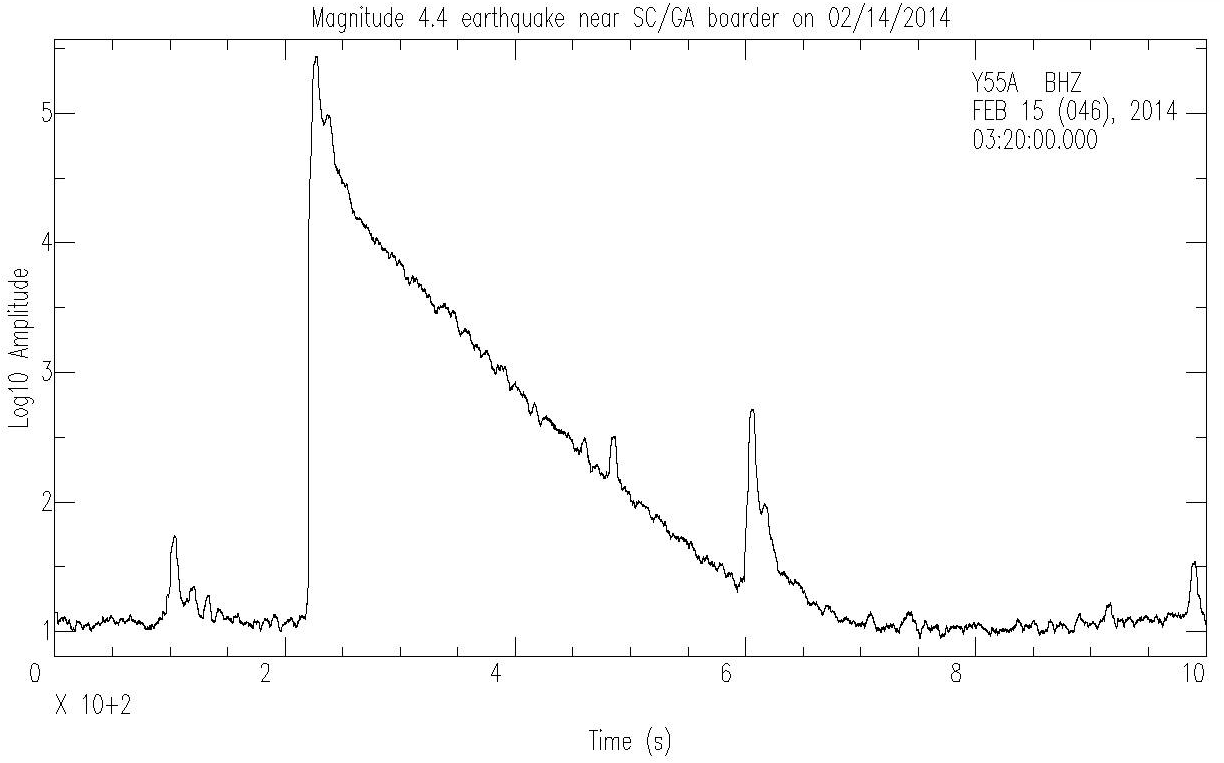
Video 1: The seismic data is recorded at a USArray station Y55A about 23 km away from the epicenter. The data is played at 50 times the normal speed, and the amplitude is 50 times louder. The loudest noise is from the mainshock, and two pops are likely aftershocks. (Zhigang Peng, Georgia Tech)


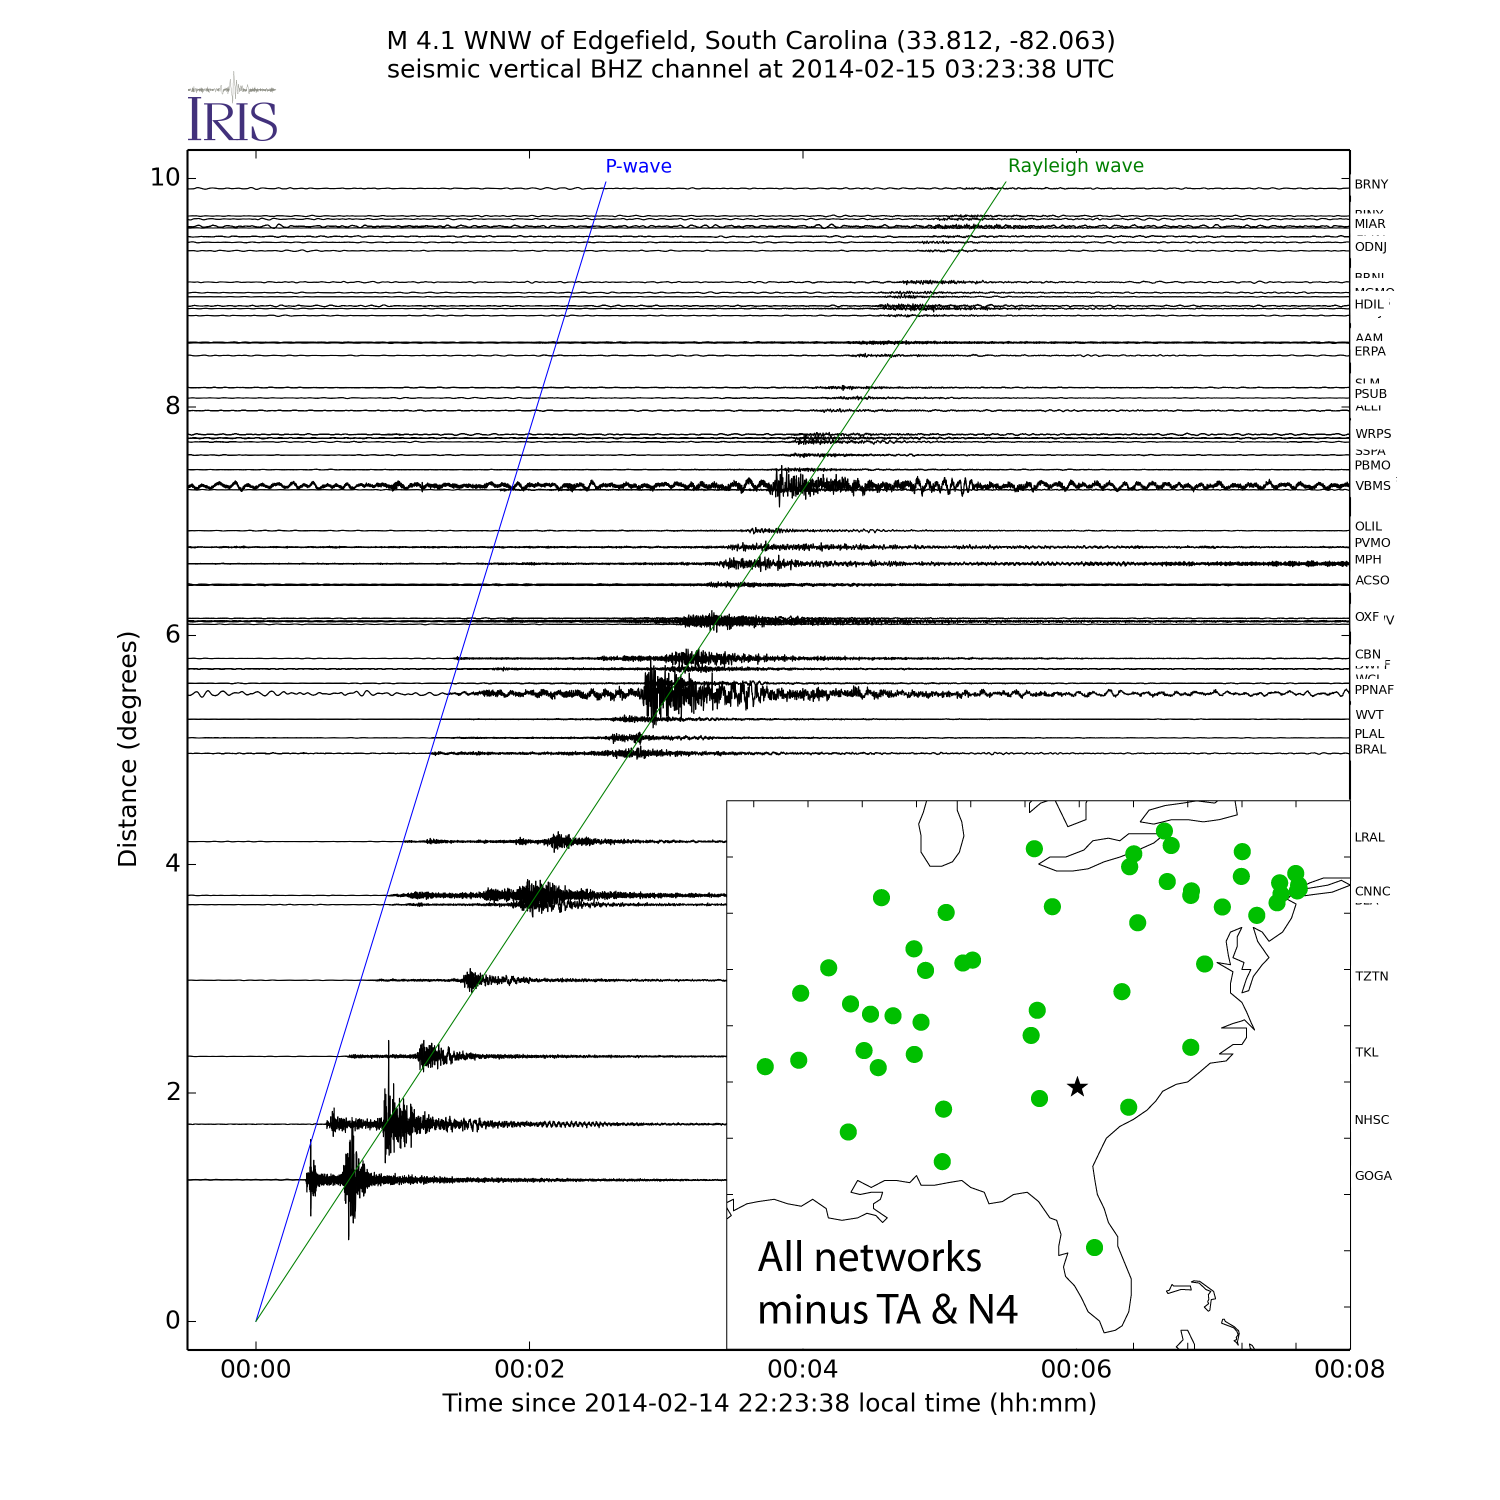
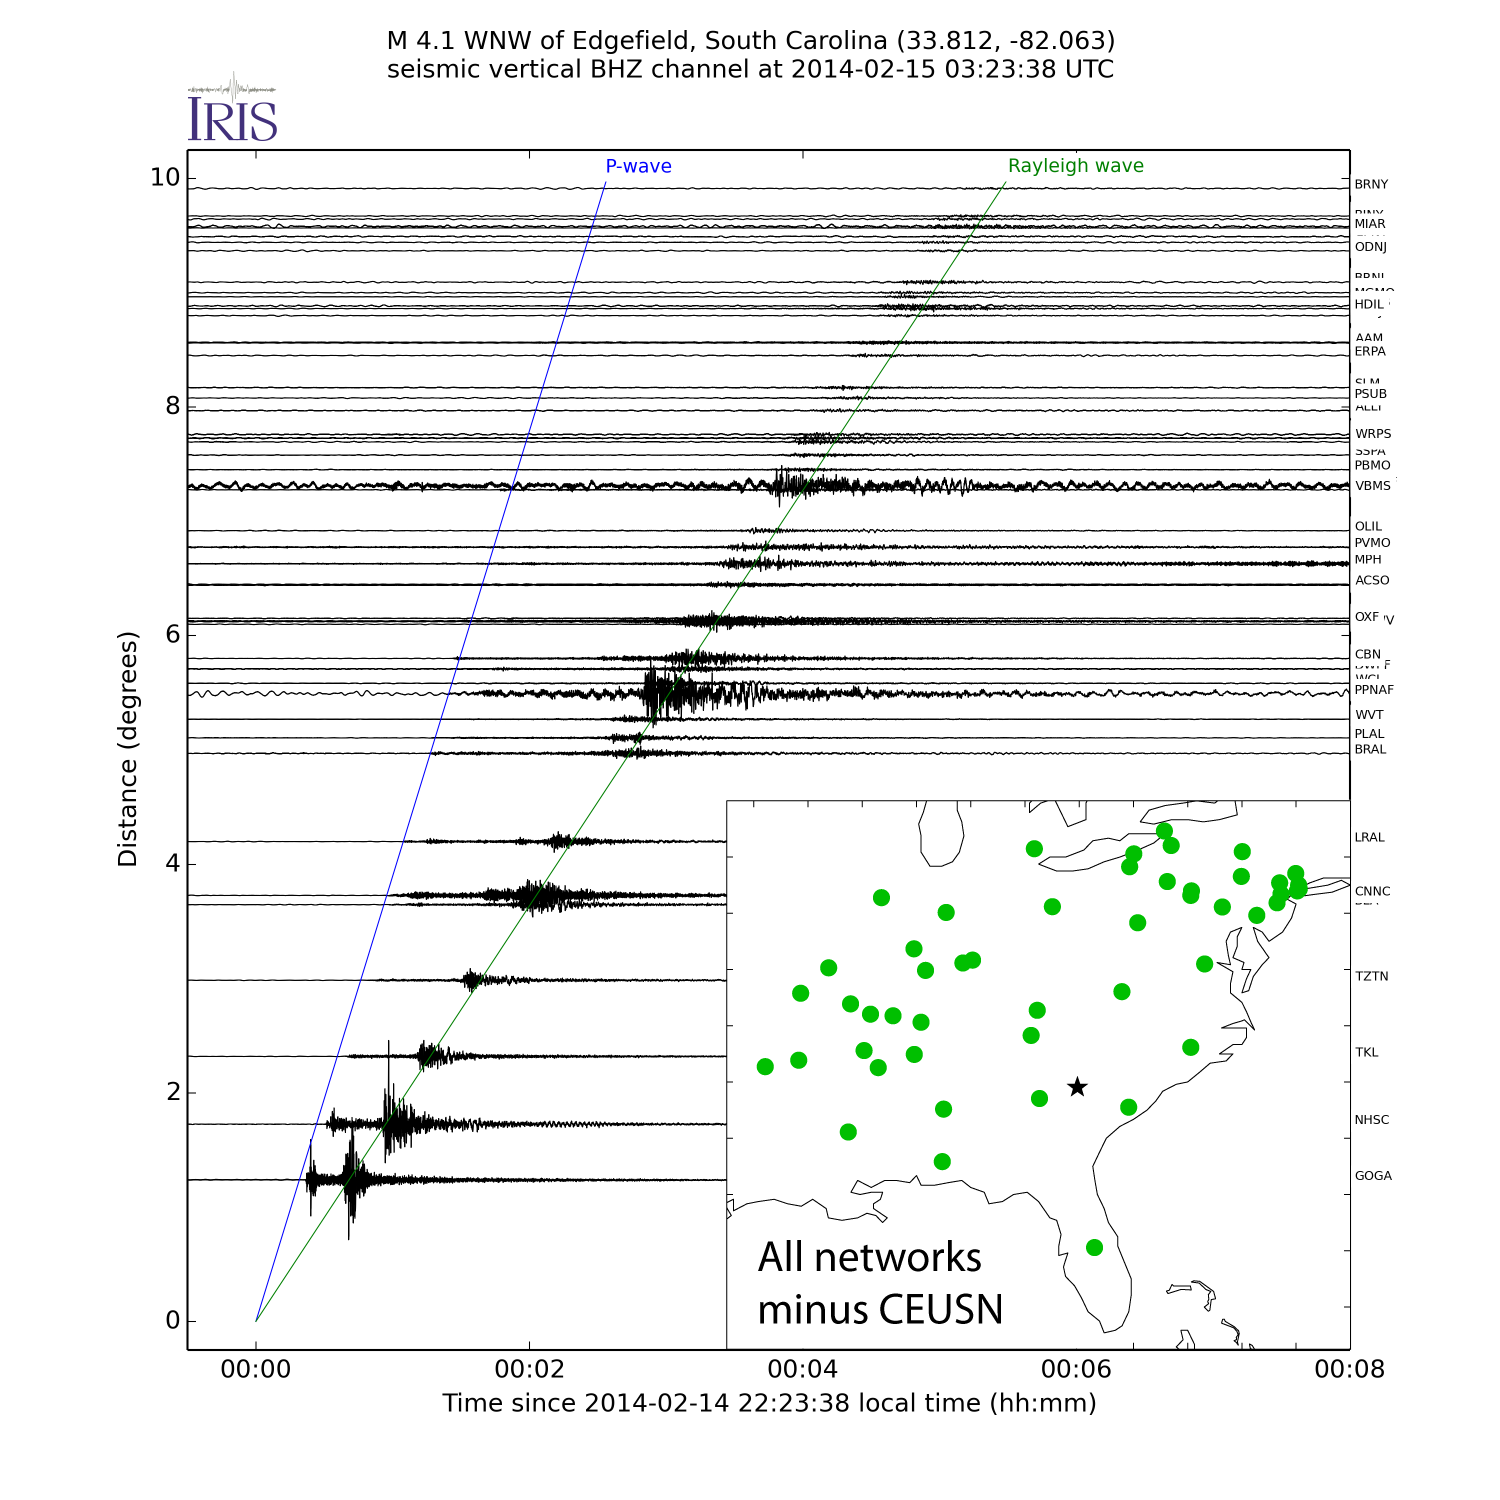

SAGE Facility Event Page
The SAGE Facility event page for this event contains links to additional tools and data.
Related Content
These other pages were tagged similarly:
- North Korea nuclear explosion [Special Event: 2013-02-12]
- Tohoku, Japan earthquake [Special Event: 2011-03-11]
- Chelyabinsk, Russia bolide (meteor) [Special Event: 2013-02-19]
- Super Typhoon Haiyan [Special Event: 2013-11-07]
- Nepal [Special Event: 2015-04-25]
- Nepaltemp [Special Event: 2015-04-30]
- Illapel, Chile [Special Event: 2015-09-16]
- 2016 North Korean nuclear test [Special Event: 2016-01-05]
- South Island, New Zealand [Special Event: 2016-11-13]
- 2017 North Korean nuclear test [Special Event: 2017-09-03]


