


This Special Event web page is intended to provide direct links to and images of data and materials available from SAGE programs and preliminary research results from the seismology community. We welcome any additional contributions containing original content that might be of interest to the research community. Please send them to the email address listed below.
SAGE does not necessarily endorse the views or scientific validity of the posted items.
January 23, 2018 M7.9 Gulf of Alaska earthquake
Email contributions to:
special-events@lists.ds.iris.edu
Note:
All scientific contributions addressed to the community will be forwarded to the special-events mailing list.
If you DO NOT want your email being forwarded, please address it to SAGE or explicitly write
do not forward.
Quick Links
Email contributions to: 
special-events@lists.ds.iris.edu
Event parameters (from USGS) 
These are preliminary results and are subject to change without notice. Please check the USGS page for the latest official information.
| Magnitude | 7.9 |
|---|---|
| UTC Time | Tuesday January 23, 2018 at 09:31:42 UTC |
| Location | 56.046°N 149.073°W |
| Depth | 25.0 km |
| Region | Gulf of Alaska |
| Distance | 280km SE of Kodiak, Alaska |
| Details | USGS Executive summary page |
Links 


- IRIS Earthquake Sci, @IRIS_EPO
- Alaska Earthquake Center, @AKEarthquake
- Stephen Hicks, @seismo_steve
- Anthony Lomax, @ALomaxNet
- patton_cascadia, @patton_cascadia
- Jascha Polet, @CPPGeophysics

Figures 
[USGS Event KML] USGS ShakeMap
[UNAVCO] Preliminary real-time GPS/GNSS results and magnitude 
estimate calculated from the geodetic data for the M 7.9 earthquake 280km SE of
Kodiak, Alaska. Traces show the 1-sps (1-Hz) displacements generated by
UNAVCO in real-time. The vertical dashed line shows the event origin time.
Blue and red dots show the predicted P-wave and S-wave arrival times. The
Magnitude Scaling Relation plot to the right shows the Peak Ground Displacements
(PGD) calculated automatically from the displacement traces. The magnitude
derived from inverting the PGDs, M7.8, is shown as a green dashed line. Only sites
at less than 1000 km from the event (black triangles) are used to invert for the
magnitude. Sites > 1000 km from the event and AC20 and AV34 are excluded.
These estimates will be updated with further analysis. Figure by Kathleen
Hodgkinson, UNAVCO;
more at https://www.unavco.org/highlights/2018/alaska.html
[GEOSCOPE Observatory] Automatic determination of source parameters using 
the SCARDEC method
[Jay Patton online] Earthquake Report: Gulf of Alaska!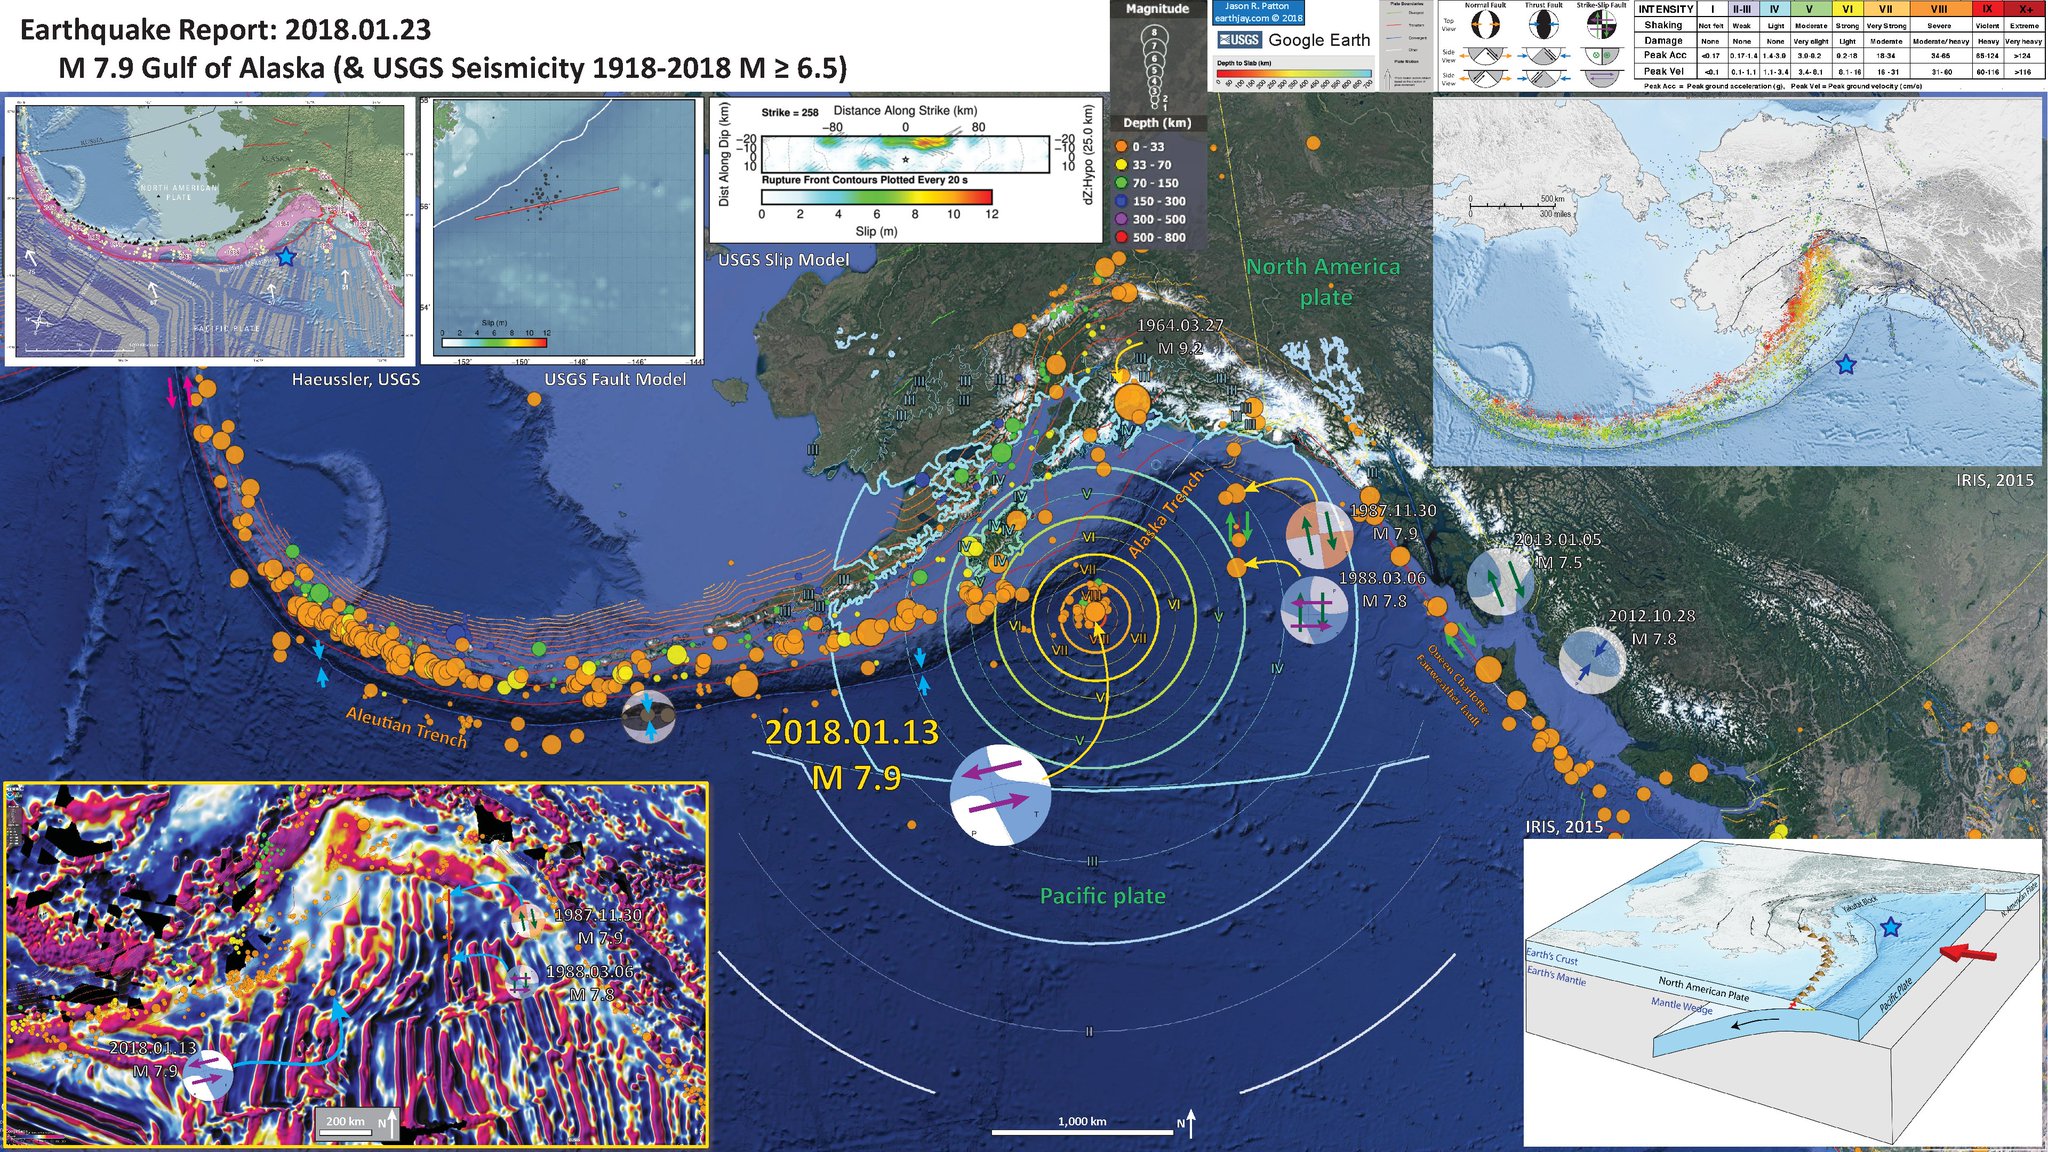
[Stephen Hicks @seismo_steve] Map of sea-floor geophysical 
features in Gulf of Alaska from a paper in 1973 shows a number of east-west
trending fracture zones in Pacific plate. Possible that today’s M7.9 earthquake
occurred along one of these – reasonably consistent with faulting mechanism
from seismic data
[IRIS DMC Event Plots Product] Combined and aligned on origin 0.3 to 1.0 Hz
BHZ (click on image to access the EventPlots).
Videos & Animations 

[IRIS DMC GMV Product] Alaska view of the Ground Motion Visualization (LHZ,LHN,LHE)
M7.9 earthquake, GULF OF ALASKA
Miscellaneous Contributions 
M7.9 Alaskan Earthquake recorded in Nevada using the Raspberry Shake (4.5 Hz) and a 1 Hz geophone
[Jim O'Donnell, HHseismic] The M7.9 event was recorded on two sites recording with Raspberry Shake (RS) seismometers (Z component); One at Nevada State College (Henderson) and one in Boulder City, 11 Kms separation, see Figures 1and 1aa. The Boulder City site also had 4.5, 2.5 and 1.0 Hz geophones recording on a Sigma 4 recorder for comparison. The comparison is quite good as can be seen in the Time Series and the Amplitude Spectra below for the RS and 1 Hz geophone. The RS uses a standard 4.5 Hz geophone (29V/m/s) while the 1 Hz geophone has an output of 200V/m/s. For many years prior to the development of Broad Band seismometers, like the Guralp CMG-3T in ~1980, the 1 Hz geophone was a very popular sensor in recording earthquakes in the western US.
The RS uses an inverse filter, in real time, to extend the frequency response from 4.5 Hz (~0.2s) to 0.2 Hz (5s). The 5s (0.2 Hz) response was modified to a 20s (0.05 Hz) response with a digital inverse filter. Consequently all the sensors (geophones) had the same response which was extended to f=0.05 (20s). This works quite nicely if you can stay above the noise of the recorder/sensor. Both the programs used to process the data and apply the Inverse filters were: WinQuake (Larry Cochrane-Public Seismic Network) and Sigma 4 (John Giles- Seismic Source Company). The RS also comes with adequate software to enable you to output rough plots and mini-seed format for further analysis (http://www.raspberryshake.org).


SAGE Facility Event Page
The SAGE Facility event page for this event contains links to additional tools and data.
Related Content
These other pages were tagged similarly:
- Hawaii [Special Event: 2018-05-04]
- North of Anchorage, Alaska [Special Event: 2018-11-30]
- Central California [Special Event: 2019-07-04]
- Northern Peru [Special Event: 2019-05-26]
- 2017 North Korean nuclear test [Special Event: 2017-09-03]
- Are You Ready? Introducing Research Ready Data Sets (RRDS) [Newsletter Article: 2018-03-26 Vol. 20, Num. 1]
- GMV2 [Product]
- Generalized GMVs: post-TA ground motion visualizations [Newsletter Article: 2025-12-28 Vol. 22, Num. 2]
- How do I interpret magnitudes and magnitude types? [FAQ]
- South Island, New Zealand [Special Event: 2016-11-13]


