Posted on
Contents
- What is MUSTANG?
- What can MUSTANG do for me?
- What can this tutorial do for me?
- First Some Terms
- How Do I Get Started?
- Sample Tasks
What is MUSTANG?
MUSTANG (Modular Utility for STAtistical kNowledge Gathering) is a quality assurance system at the IRIS Data Management Center that provides metrics pertaining to seismic data quality. MUSTANG also provides noise measurements in the form of Power Spectral Densities (PSD) and Probability Density Functions (PDF). As a collection of web services, you can query MUSTANG for and receive data quality measurements on data of interest to you over the Internet using a variety of access approaches.
The components of MUSTANG include
- A PostgreSQL database that stores measurements,
- The Master Control Runtime (MCR) that schedules metrics to run on data,
- The Backend Storage Service (BSS) that stores and retrieves measurements to and from the database, and
- The MUSTANG Metrics Engine (MME) that calculates measurements for data quality metrics.
- The PASTURE maintenance system that detects which measurements need recalculating due to new data or metadata or changes in metrics software.
What can MUSTANG do for me?
The purpose of MUSTANG is to help users assess the quality of data in the IRIS DMC archive. It can help network operators decide how best to allocate maintenance resources. Data users can identify data that has the needed quality for their research objectives.
What can this tutorial do for me?
The goal of this tutorial is to introduce MUSTANG concepts and tools to the first-time user in an order that builds on previous steps. The desired outcome is that the reader will have an overview of what MUSTANG can do and obtain the skills needed to use MUSTANG as they wish.
First Some Terms
A common understanding of a few important terms will help when reading this tutorial and other MUSTANG documentation.
metric – an algorithm that calculates some measurement value related to data quality.
measurement – a value calculated by a data quality metric for a single data channel for a given date-time. These are the values you will retrieve to assess data quality.
web service – a software interface having a network address (URL) through which other software or devices can interact with it over the Internet.
target – a data channel described by its SEED network, station, location, and channel ids plus its SEED quality code. (Example: IU.ANMO.00.BHZ.M) Metrics run on targets to produce measurements. (Also called a SNCLQ.)
How Do I Get Started?
Finding MUSTANG
MUSTANG resides here:
http://service.iris.edu/mustang/
It includes eight services that return different types of data and have different query parameters and output formats appropriate to the data they serve:
- measurements – values calculated from the running of all metrics other than PSD/PDF metrics.
- noise-pdf – instrument-corrected Power Spectral Density (PSD) data plotted as Probability Density Functions (PDFs).
- noise-psd – instrument-corrected Power Spectral Density data plotted as individual curves.
- noise-spectrogram – time series of Power Spectral Density daily mode values at all periods.
- noise-pdf-browser – browsable views of MUSTANG PDF plots.
- noise-mode-timeseries – time series of Power Spectral Density daily mode values at specific periods.
- metrics – descriptions of metrics.
- targets – list of targets that have at least one measurements for a given metric during their archive history.
Clicking on the link for each of these services reveals four tabs/pages for each:
- The Service interface describes the query options available for this service, showing sample queries that demonstrate what the service can do.
- The URL Builder is a web form interface that simplifies construction of URL queries for that service.
- The Help page lists additional details for query parameters presented on the Service interface page. Both of these pages include a red Current list of all metrics button that displays a brief description of each metric and a link to more “Detailed Documentation” describing how the algorithm works and how the metric might be used for data quality control.
- The Revision page documents the major revisions of the service.
The Metrics
MUSTANG metrics currently fall into eight categories:
State of Health flags from the miniSEED fixed header (except as noted)
- amplifier_saturation
- calibration_signal
- clock_locked
- digital_filter_charging
- event_begin
- event_end
- event_in_progress
- glitches
- missing_padded_data
- spikes
- suspect_time_tag
- telemetry_sync_error
- timing_correction
- timing_quality (miniSEED blockette 1001)
Whether or not these flags are set in the miniSEED data depends on what type of datalogger was used, how the data was transmitted and what quality control steps were taken before the data arrived at the DMC. A zero value for these metrics may just indicate that the flag was never set. When a flag is set, the interpretation and/or value of the flag may depend on datalogger type.
Data transmission and archiving
- data_latency
- feed_latency
- total_latency
- percent_availability
- ts_percent_availability
- ts_percent_availability_total
- station_completeness
Data continuity
- ts_channel_continuity
- channel_uptime
- ts_channel_up_time
- ts_gap_length
- ts_gap_length_total
- max_gap
- ts_max_gap
- ts_max_gap_total
- max_overlap
- num_gaps
- ts_num_gaps
- ts_num_gps_total
- num_overlaps
Time series amplitude statistics
- sample_max
- sample_mean
- sample_median
- sample_min
- sample_rms
- sample_snr
Signal anomalies
- cross_talk
- dc_offset
- dead_channel_gsn
- dead_channel_lin
- max_stalta
- num_spikes
- pressure_effects
Noise analysis
- asl_coherence (IC, II, IU, US networks)
- noise-psd
- noise-pdf
- noise-mode-timeseries
- pct_above_nhnm
- pct_below_nlnm
Metadata accuracy
- m2_tides
- orientation_check
- polarity_check
- timing_drift
- transfer_function
Error logging
- metric_error
Querying
Because MUSTANG is a web service, HTTP queries for its data can be typed directly into the URL textbox of a browser. Alternatively, a batch script can send that same query using a curl or wget command, or a client application can send the queries and display returned data. This section describes how to construct the basic URL query; the section on Clients and Visualization discusses these other options.
Queries for MUSTANG data begin with the MUSTANG URL:
http://service.iris.edu/mustang/
followed by the relative path of one of its services:
- noise-pdf/1/
- noise-psd/1/
- noise-spectrogram/1/
- noise-pdf-browser/1/
- noise-mode-timeseries/1/
- measurements/1/
- metrics/1/
- targets/1/
followed by
- /query?
Finally, the query parameters, which vary according to the service used, are appended to this prefix. Query parameters for each service are described on its Service Interface tab. Parameters and values take the form
- parameter=value
and are appended directly to /query?. Successive query parameters are separated by an ampersand (&).
Using the measurements services as an example, the first parameter is
- metric
It is required. You’ll also want to specify an output
- format
For now we’ll specify “text”. More on output formats later.
Adding only these two parameters will return all measurements for that metric for the entire IRIS archive over time (a bad idea), so queries need to include additional parameters to limit the results, such as the channels of interest:
http://service.iris.edu/mustang/measurements/1/query?metric=num_gaps&net=IU&sta=LSZ&loc=00&chan=BHZ&format=text
This query would return the number of gaps for each day of IU.LSZ.00.BHZ data in the IRIS DMC archive. To limit the time span of the measurements returned, you can add a timewindow:
This query returns number of gaps measurements for IU.LSZ.00.BHZ that start beginning Oct. 15, 2014 00:00:00 UTC and end by Oct. 20, 2014 00:00:00 UTC inclusive:
“Num Gaps Metric”
“value”,“target”,“start”,“end”,“lddate”
“18”,“IU.LSZ.00.BHZ.M”,“2013/10/15 00:00:00”,“2013/10/16 00:00:00”,“2014/02/22 07:49:52.438791”
“6”,“IU.LSZ.00.BHZ.M”,“2013/10/16 00:00:00”,“2013/10/17 00:00:00”,“2014/02/22 07:49:44.760219”
“1”,“IU.LSZ.00.BHZ.M”,“2013/10/17 00:00:00”,“2013/10/18 00:00:00”,“2013/10/21 07:37:46.851601”
“0”,“IU.LSZ.00.BHZ.M”,“2013/10/18 00:00:00”,“2013/10/19 00:00:00”,“2013/10/22 04:55:13.844849”
“0”,“IU.LSZ.00.BHZ.M”,“2013/10/19 00:00:00”,“2013/10/20 00:00:00”,“2013/10/22 07:43:03.935140”
The next URL return only nonzero gap counts:
where “value” is the name of the measurement for this metric. (Metrics that calculate only one measurement value usually store this measurement under the name “value” in the database.)
“Num Gaps Metric”
“value”,“target”,“start”,“end”,“lddate”
“18”,“IU.LSZ.00.BHZ.M”,“2013/10/15 00:00:00”,“2013/10/16 00:00:00”,“2014/02/22 07:49:52.438791”
“6”,“IU.LSZ.00.BHZ.M”,“2013/10/16 00:00:00”,“2013/10/17 00:00:00”,“2014/02/22 07:49:44.760219”
“1”,“IU.LSZ.00.BHZ.M”,“2013/10/17 00:00:00”,“2013/10/18 00:00:00”,“2013/10/21 07:37:46.851601”
The next URL sorts the measurements from smallest to largest:
“Num Gaps Metric”
“value”,“target”,“start”,“end”,“lddate”
“1”,“IU.LSZ.00.BHZ.M”,“2013/10/17 00:00:00”,“2013/10/18 00:00:00”,“2013/10/21 07:37:46.851601”
“6”,“IU.LSZ.00.BHZ.M”,“2013/10/16 00:00:00”,“2013/10/17 00:00:00”,“2014/02/22 07:49:44.760219”
“18”,“IU.LSZ.00.BHZ.M”,“2013/10/15 00:00:00”,“2013/10/16 00:00:00”,“2014/02/22 07:49:52.438791”
The orderby parameter can be included multiple times to add secondary sort keys and more.
There are additional ways to limit query results by channel, time and value that are described in detail on the Service Interface page of each MUSTANG service.
Measurements
Query results usually include
- one or more values calculated by the selected metric
- the target to which the measurement belongs
- the start and end date-time over which the measurement was calculated
- the date the measurement was made.
“Num Gaps Metric”
“value”,“target”,“start”,“end”,“lddate”
“1”,“IU.LSZ.00.BHZ.M”,“2013/10/17 00:00:00”,“2013/10/18 00:00:00”,“2013/10/21 07:37:46.851601”
Most metrics are single-valued – they produce one measurement labeled “value”. Others are multivalued and their measurements have more descriptive names:
“Transfer Function Metric”
“gain_ratio”,“phase_diff”,“ms_coherence”,“target”,“start”,“end”,“lddate”
“0.992300”,“0.115500”,“1.00000”,“IU.ANMO.10:00.BHZ.M”,“2014/09/21 17:24:00”,“2014/09/21 18:23:59”,“2014/10/02 17:27:45.182677”
Many metrics are measured over 24-hour data windows (e.g. num_gaps), although the example above shows that this is not always the case.
Network and Channel Coverage
Currently seismic channels from all networks in the IRIS SEED archive have measurements for metrics whose algorithms are appropriate to the channel type.
Output Formats
Although we retrieved our measurements in text format in the previous examples, MUSTANG services return data in a variety of output formats appropriate to its data. Because MUSTANG is comprised of web services, anyone can write their own client to retrieve, manipulate and plot MUSTANG data, so many of these formats are included for ease of reading by clients and their scripting languages. For example, the measurement service provides these output formats:
- text – easiest for users to read in browsers
- a CSV (comma-separated values) file – for easy parsing and import into Excel
- XML – readable by other web services, Python, Java and other languages.
- JSON/JSONP – readable by JavaScript clients, such as LASSO (more on LASSO in the next section)
Services that return graphical information, such as noise-pdf, include plot options.
Clients and Visualization
Anyone can write a client for MUSTANG that retrieves data and manipulates it according to their needs. A few have already been written, are available for use and will be described in more detail in the Sample Tasks section. These include:
- URL Builder – a web form that builds queries. Clicking on the resulting URL in the Builder returns a new web page containing the data in the requested format (text, PDF plots, etc.)
- LASSO (Latest Assessment of Seismic Station observations) – retrieves measurements by virtual network and displays color-coded results by target based on predefined thresholds. (http://lasso.iris.edu)
- MUSTANG Databrowser – an R web client that allows users to visualize MUSTANG measurements individually or in groups using a variety of plot types. (http://ds.iris.edu/mustang/databrowser/)
- MUSTANGular – a web client developed at University of Washington that displays MUSTANG measurements on a map. (http://ds.iris.edu/mustang/mustangular/#/form)
Sample Tasks
How Do I Find Badly Off-Center Masses for network IU in September of 2014?
An easy way to discover off-center masses in a network is to explore measurements with the MUSTANG Databrowser. To do this,
- Pull up the Databrowser in a web browser (http://ds.iris.edu/mustang/databrowser/)
- Under Plot Type, select Network Boxplots to view all measurements from all stations having the same network, location and channel codes.
- Under Metric, select Daily Mean Amplitude – channels with off-center masses will have very large or very small mean amplitudes.
- Select the IU network, location code 00 and channel VMZ for beginning September 1, 2014 and ending September 30, 2014. The station name doesn’t matter since all IU stations having location code 00 and channel VMZ.
- Plot Data:
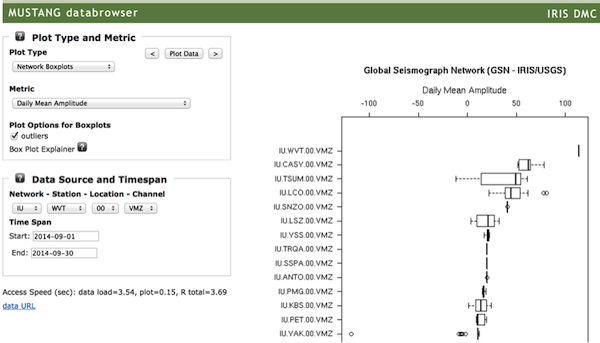
IU.WVT.00.VMZ has a daily mean amplitude larger than 100 counts – this mass is sure to be against the stops, particularly if the maximum, minimum and mean amplitudes for BHZ are similar in size.
As an aside, box plots are essentially a birds-eye view of a distribution curve where the dark line is the median of the measurements, the box edges are the first and third quartiles and the whiskers with dotted lines are the 95% confidence interval of the median. Outliers plot as circles outside the whiskers.
To check basic amplitude statistics for IU.WVT.00.BHZ, we change the channel name to BHZ, the Plot Type to Multiple Metric Time Series, the Metric to Min-Max-Mean and the Station to WVT. Plot Data:
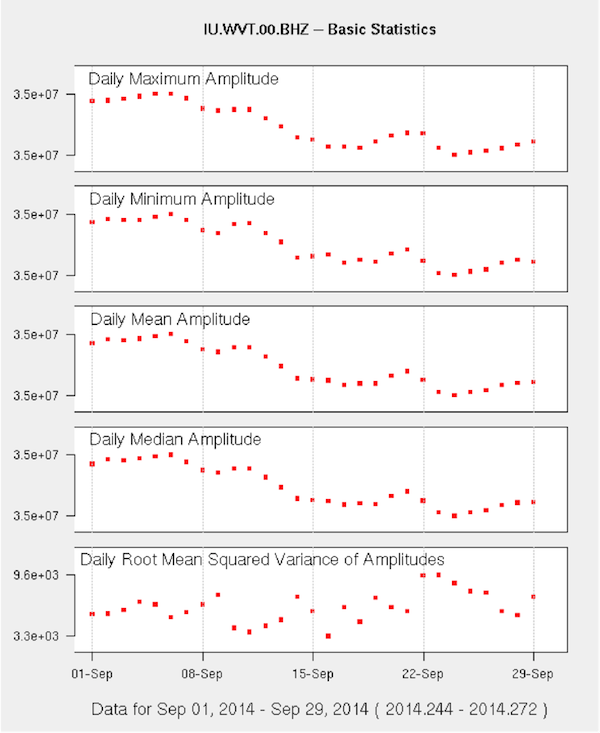
The amplitude minima, maxima and means are similar, so this mass needs re-centering.
I Have an Off-Center Mass – How Long Has It Been That Way?
It’s quickest to use the numerical measurements from the URL Builder for the measurement service to narrow down an onset date. Since we know IU.WVT.00.BHZ was off-center throughout September, we’ll request sample_mean measurements for 8/10 through 9/10/2014 and sort them in descending order by start date. For variety, we’ll send the query with curl on the command line and exclude the date the metric was calculated for ease of reading:
curl “http://service.iris.edu/mustang/measurements/1/query?metric=sample_mean&net=IU&sta=WVT&loc=00&cha=VMZ&format=text&timewindow=2014-08-10T00:00:00,2014-09-10T00:00:00&orderby=start_desc” | awk -F , ‘{print $1,$2,$3,$4}’
The results:
“Sample Mean Metric”
“value” “target” “start” “end”
“113.806” “IU.WVT.00.VMZ.M” “2014/09/09 00:00:00” “2014/09/10 00:00:00”
“113.824” “IU.WVT.00.VMZ.M” “2014/09/08 00:00:00” “2014/09/09 00:00:00”
“113.854” “IU.WVT.00.VMZ.M” “2014/09/07 00:00:00” “2014/09/08 00:00:00”
“113.873” “IU.WVT.00.VMZ.M” “2014/09/06 00:00:00” “2014/09/07 00:00:00”
“113.875” “IU.WVT.00.VMZ.M” “2014/09/05 00:00:00” “2014/09/06 00:00:00”
“113.867” “IU.WVT.00.VMZ.M” “2014/09/04 00:00:00” “2014/09/05 00:00:00”
“113.863” “IU.WVT.00.VMZ.M” “2014/09/03 00:00:00” “2014/09/04 00:00:00”
“113.862” “IU.WVT.00.VMZ.M” “2014/09/02 00:00:00” “2014/09/03 00:00:00”
“113.852” “IU.WVT.00.VMZ.M” “2014/09/01 00:00:00” “2014/09/02 00:00:00”
“113.854” “IU.WVT.00.VMZ.M” “2014/08/31 00:00:00” “2014/09/01 00:00:00”
“113.874” “IU.WVT.00.VMZ.M” “2014/08/30 00:00:00” “2014/08/31 00:00:00”
“113.896” “IU.WVT.00.VMZ.M” “2014/08/29 00:00:00” “2014/08/30 00:00:00”
“113.883” “IU.WVT.00.VMZ.M” “2014/08/28 00:00:00” “2014/08/29 00:00:00”
“113.887” “IU.WVT.00.VMZ.M” “2014/08/27 00:00:00” “2014/08/28 00:00:00”
“83.0000” “IU.WVT.00.VMZ.M” “2014/08/24 00:00:00” “2014/08/25 00:00:00”
“81.8970” “IU.WVT.00.VMZ.M” “2014/08/23 00:00:00” “2014/08/24 00:00:00”
“78.1860” “IU.WVT.00.VMZ.M” “2014/08/22 00:00:00” “2014/08/23 00:00:00”
“76.3510” “IU.WVT.00.VMZ.M” “2014/08/21 00:00:00” “2014/08/22 00:00:00”
“76.9930” “IU.WVT.00.VMZ.M” “2014/08/20 00:00:00” “2014/08/21 00:00:00”
“77.5070” “IU.WVT.00.VMZ.M” “2014/08/19 00:00:00” “2014/08/20 00:00:00”
“77.6210” “IU.WVT.00.VMZ.M” “2014/08/18 00:00:00” “2014/08/19 00:00:00”
“77.0280” “IU.WVT.00.VMZ.M” “2014/08/17 00:00:00” “2014/08/18 00:00:00”
“77.3210” “IU.WVT.00.VMZ.M” “2014/08/16 00:00:00” “2014/08/17 00:00:00”
“77.5490” “IU.WVT.00.VMZ.M” “2014/08/15 00:00:00” “2014/08/16 00:00:00”
“77.5190” “IU.WVT.00.VMZ.M” “2014/08/14 00:00:00” “2014/08/15 00:00:00”
“76.9820” “IU.WVT.00.VMZ.M” “2014/08/13 00:00:00” “2014/08/14 00:00:00”
“76.5900” “IU.WVT.00.VMZ.M” “2014/08/12 00:00:00” “2014/08/13 00:00:00”
“76.3940” “IU.WVT.00.VMZ.M” “2014/08/11 00:00:00” “2014/08/12 00:00:00”
“76.8640” “IU.WVT.00.VMZ.M” “2014/08/10 00:00:00” “2014/08/11 00:00:00”
show that this channel mass began drifting on 2014/08/23 and came to rest against its stop by 2014/08/27. (Remember that these values are the mean over a 24-hour period.)
We can display the trace in the Databrowser by:
- selecting seismic trace as the Plot Type,
- setting the data source to IU WVT 00 BHZ and
- the time span from 2014-08-22 to 2014-08-29.
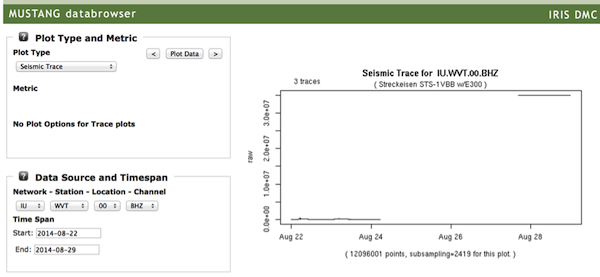
The plot reveals a data gap from 2014/08/24 to 08/27.
Changing the Plot Type to PDF Plot shows the change from a normal spectrum with healthy energy on the microseism peaks (~1-20 seconds period) to a flat spectrum:
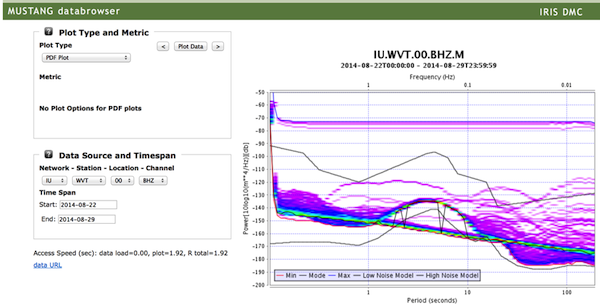
What Other Channels are Dead Besides Those With Off-Center Masses?
There may be channels with small mean amplitudes that are also not recording seismic energy, perhaps because the instrumentation has failed or is missing. These channels will have both a normal sample_mean and a low value for the metric dead_channel_lin. (dead_channel_lin reports the error you get if you try to fit a line to a target’s daily mean PSD. Observationally, a dead channels’ power tends to decay fairly linearly. The smaller the error reported, the less likely it is that the channel is recording seismic energy. BH channels are particularly diagnostic since they record the microseism peaks when healthy.) We’ll use the URL Builder because we want to apply a value constraint to the values returned.
- Select the dead_channel_lin metric from the pull-down list.
- Enter the network IU and channel BHZ, leaving the station and location fields blank to retrieve matching targets of all stations and location codes.
- Again, enter start and end times of 2014-09-01T00:00:00 and 2014-10-01T00:00:00.
- Under Value Constraints, set the Parameter to value, the Condition to Greater than and the value to 2.5.
- Sorting will be by target Ascending.
Other stations and location codes with dead channels for several days during this month include
- ANTO.00
- FUNA.00
- KOWA.00
- MBWA.10
- PTGA.00
- SLBS.00
- TRQA.00
To determine how much of the month the channel was dead (take IU.ANTO.00.BHZ, for example), we’ll go to the noise-pdf service to look at the PSD data:
1. Go to the URL builder for MUSTANG’s noise-pdf URL Builder
2. Enter the target IU.ANTO.00.BHZ for the month of September, 2014
3. Choose the Plot Format.
At this point, many plot options will become visible. The defaults are ok for this view.
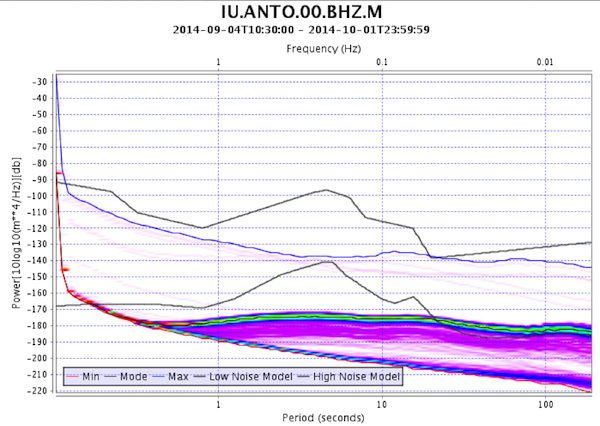
This channel has been dead all of September 2014.
What IU Stations Had No GPS Time In September 2014?
The IU network uses mainly Q330 dataloggers and their data transmission method preserves the State of Health flag the datalogger writes to the miniSEED fixed header. One of these flags records clock locks. The clock_locked metric returns a count of the number of GPS clock locks per day. We only need to check one channel per location code to find GPS problems since all channels on the same datalogger have the same timing. We’ll again use the URL Builder so that we can apply a threshold to the values returned; we’re only interested in which dates a datalogger had zero locks per day (again, for September 2014).
- Select the clock_locked metric from the pull-down list.
- Enter the network IU and channel BHZ, leaving the station and channel fields blank to retrieve matching targets of all stations and location codes.
- Again, enter start and end times of 2014-09-01T00:00:00 and 2014-09-30T00:00:00.
- Under Value Constraints, set the Parameter to value, the Condition to Equals and the value to 0.
- Sorting will be by target Ascending.
Appending another &orderby=start sorts each target by start time, making it easier to see when locking started and stopped:
The dates of our results tell us that
- ANTO lost GPS timing by 9/4/2014
- GUMO regained GPS timing on 9/21/2014
- KBL had no GPS locks throughout September 2014
- MACI has an older datalogger – its clock_locked flag is left unset (i.e. it is always zero, even when GPS locks are abundant).


