Posted on
Contents
- Finding Potential Data Problems
- Reviewing Potential Data Problems
- Some Metadata Sanity Checks
- References
Seismic data quality assurance involves reviewing data in order to identify and resolve problems that limit the use of the data – a time-consuming task for large data volumes! Additionally, no two analysts review seismic data in quite the same way. Recognizing this, IRIS developed the MUSTANG automated seismic data quality metrics system to provide data quality measurements for all data archived at IRIS Data Services. Knowing how to leverage MUSTANG metrics can help users quickly discriminate between usable and problematic data and it is flexible enough for each user to adapt it to their own working style.
This tutorial presents strategies for using MUSTANG metrics to optimize your own data quality review. Many of the examples in this tutorial illustrate approaches used by the IRIS Data Services Quality Assurance (QA) staff.
Finding Potential Data Problems
One strength of MUSTANG is that its metrics can be mined in such a way that analyst time can focus mainly on reviewing potentially problematic data. This section describes approaches for identifying potential problems in large amounts of data as part of a QA routine.
Create Reusable Scripts
Because MUSTANG is a web service, you can easily retrieve its metrics using the scripting language of your choice (e.g. R, perl, Matlab and UNIX shells). If you plan to examine data repeatedly for the same types of problems, saving your queries in a reusable script will save time. Additionally, they could run as regularly-scheduled batch jobs. Two comparable commands that your scripts can use to retrieve measurements are wget and curl:
curl -gs 'http://service.iris.edu/mustang/measurements/1/
    query?metric=percent_availability
      &network=IU
      &channel=BH[12ENZ]
      &timewindow=2015-06-01,2015-06-04
      &format=text
      &orderby=target
      &orderby=start'
or
wget -qO- 'http://service.iris.edu/mustang/measurements/1/
    query?metric=percent_availability
      &network=IU
      &channel=BH[12ENZ]
      &timewindow=2015-06-01,2015-06-04
      &format=text
      &orderby=target
      &orderby=start'
To learn more on how to construct MUSTANG queries, see the tutorial Getting Started With MUSTANG.
You could save this query as the following reusable perl script:
#!/usr/bin/env perl
$m1string = "curl -gs \'http://service.iris.edu/mustang/measurements/1/query?metric=percent_availability&network=IU&channel=BH[12ENZ]&timewindow=2015-06-01,2015-06-04&format=text&orderby=target&orderby=start\'";
print"$m1string\n";

## Retrieve results
open METRIC1, "$m1string |"
        or die "can't fork $!";
while (<METRIC1>) {
    s/"//g;
    if (/:/) {
        ($value1, $target1, $start1, @rest) = split(/,/);
        $current1 = $target1 . " " . $start1;
        $hash1{$current1} = $current1;
    }
}
close(METRIC1);
foreach (sort keys %hash1) { print "$hash1{$_}\n"; }
These commands retrieve the percent_availability of the BH channels in the IU network from 2015-06-01 to 2015-06-04 inclusive.
Use Metrics Thresholds
If you wanted to look at data return and find only stations that are down, you can request a list of station/days with zero percent_availability:
#!/usr/bin/env perl
$m1string = "curl -gs \'http://service.iris.edu/mustang/measurements/1/query?metric=percent_availability&network=IU&channel=BH[12ENZ]&timewindow=2015-06-01,2015-06-04&value_eq=0&format=text&orderby=target&orderby=start\'";
print"$m1string\n";

## Retrieve results
open METRIC1, "$m1string |"
        or die "can't fork $!";
while (<METRIC1>) {
    s/"//g;
    if (/:/) {
        ($value1, $target1, $start1, @rest) = split(/,/);
        $current1 = $target1 . " " . $start1;
        $hash1{$current1} = $current1;
    }
}
close(METRIC1);
foreach (sort keys %hash1) { print "$hash1{$_}\n"; }
Some useful metrics thresholds that indicate common potential data problems are
- Missing channels have percent_availability=0
- Channels with masses against the stops have very large absolute_value(sample_mean)
- Channels that do report GPS locks in their miniSEED headers but have lost their GPS time reference have clock_locked=0
Finding Your Own Metrics Thresholds
Metrics threshold values that flag potential data problems can often depend on each network’s tolerance levels or upon hardware type. Examples of metrics that depend on hardware type are those that assess data in units of counts without scaling or removing instrument response:
- sample_max
- sample_mean
- sample_median
- sample_min
- sample_rms
For reasons such as these, you may want to determine your own metrics thresholds for identifying certain problems.
Suppose you want to find a useful threshold for a “very large” absolute_value(sample_mean) – what is “very large” for the IU network? Knowing which channels are badly off center in your network of interest, you can query sample_mean measurements, saving the results as a CSV file and import it into Excel for plotting:
wget 'http://service.iris.edu/mustang/measurements/1/
    query?metric=sample_mean
      &net=IU
      &cha=BH[12ENZ]
      &format=csv
      &timewindow=2015-07-07T00:00:00,2015-07-14T00:00:00'
These results give the following plot:

If you sort the measurements by “value” (sample_mean) and recognize that the measurements with the largest absolute values are channels that you know to be badly off center, you can graphically choose a threshold that separates off-center masses from those that are not. Absolute_value(sample_mean) > 1.e+7 does this for the IU network.
Some metrics are based on Power Spectral Density (PSD) calculations, so they do have instrument response removed. Thresholds for these metrics generally do not need to be adjusted for hardware type at BH sample rates:
- dead_channel_lin
- dead_channel_gsn
- pct_below_nlnm
- pct_above_nhnm
- transfer_function
It will help to know what the first four metrics do before going on. The following Probability Density Function (PDF) plot of PSD spectra for IU.TRQA.00.BHZ in June of 2015 (Figure 2) shows the signatures of a channel that was dead, subsequently serviced and calibrated, and became functional once again.
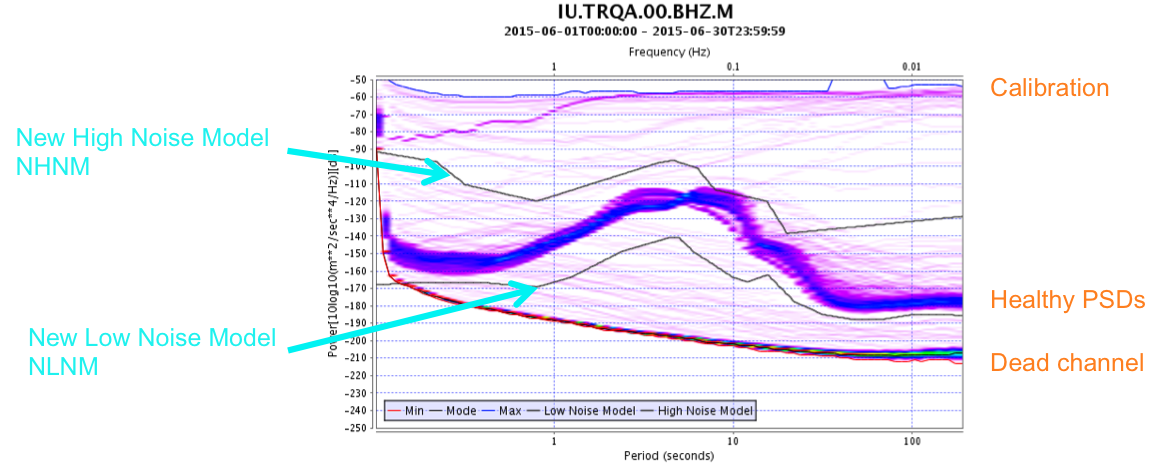
Metrics pct_below_nlnm and pct_above_nhnm return the percentage of frequency-power bins in the PDF plot that lie below or above the Peterson (1993) New High or Low Noise Models (essentially the envelope of digital broadband stations running as of 1993). PSDs lying outside of these lines (they yield no-zero values for these metrics) represent channel/times when high noise was present or when the channel was not recording background noise normally.
The metric dead_channel_lin takes advantage of the observation that a dead channel has a PSD spectrum in power-log(frequency) space that resembles a line in the microseism band. It returns the standard deviation of the residuals obtained when fitting a line to the PSD mean for that day. The larger the value of this metric, the less the channel is likely to be dead.
Alternatively, dead_channel_gsn calculates the difference median power and New Low Noise Model (NLNM) at each PDF frequency between 4 and 8 seconds. If the difference exceeds 5.0 dB, dead_channel_gsn returns 1 for TRUE. If not, it returns 0 (FALSE).
Using an approach for finding a threshold much like the method illustrated above, Data Services staff have found that
- pct_below_nlnm >= 20
did a good job of identifying channels with low amplitude problems in the Global Seismic Network (GSN). When using this metrics threshold on another network, it turned up two channels that had typographical errors in the instrument response:
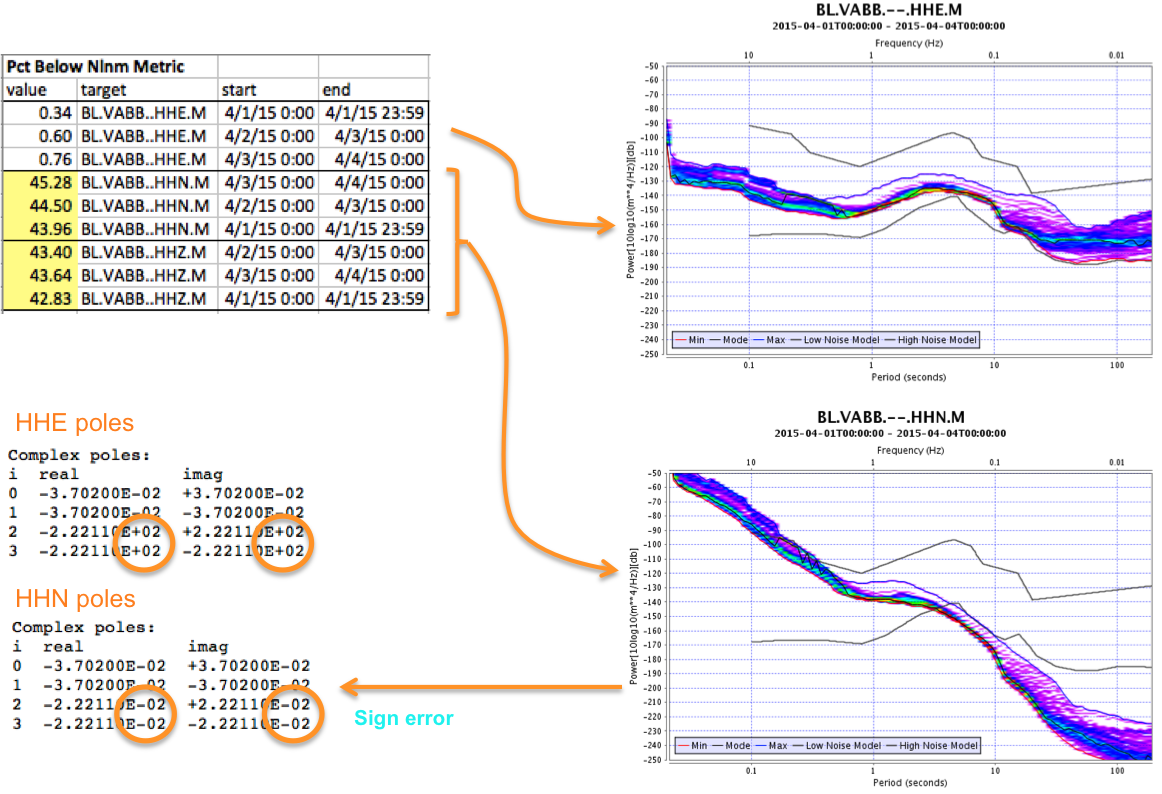
The difference between the channel whose PSDs fall within the New Noise Model envelope and the channel that does not is the sign of the exponent for two of the sensor poles.
Here is an example of a reusable perl script that retrieves IU channel/days where pct_below_nlnm>20:
#!/usr/bin/env perl

$m1string = "curl -gs \'http://service.iris.edu/mustang/measurements/1/query?metric=pct_below_nlnm&network=IU&channel=BH[12ENZ]&timewindow=2015-06-01,2015-06-04&value_ge=20&format=text&orderby=target&orderby=start\'";

@arrMetric1 = ();

open METRIC1, "$m1string |"
        or die "can't fork $!";
print"$m1string\n";
while (<METRIC1>) {
    s/"//g;
    if (/:/) {
        ($value1, $target1, $start1, @rest) = split(/,/);
        print "$target1\t$start1\n";
    }
}
close(METRIC1);
Combine Metrics
Identifying dead channels is a common quality assurance task. Figure 3 showed that, while using the pct_below_nlnm may return dead channels, it will also report healthy channels that have other types of issues. Combining multiple metrics can help tune your queries to find specific types of problems. For example, the channel with the response errors (Figure 3) triggered the pct_below_nlnm threshold, but its PDF mean doesn’t have the linear shape of a channel that records no seismic signal at all. Similarly, the “calibration” PSD curves for IU.TRQA.00.BHZ (Figure 2) are linear, but don’t fall below the NLNM. Combining these two metrics to return channel/days having both
- significant energy below the NLNM (pct_below_nlnm>=20) and
- a median PSD that fits a linear curve fairly well (dead_channel_lin<2)
should identify dead channels reliably.
The following perl script:
#!/usr/bin/env perl

$m1string = "curl -gs \'http://service.iris.edu/mustang/measurements/1/query?metric=pct_below_nlnm&network=IU&channel=BH[12ENZ]&timewindow=2015-06-01,2015-06-04&value_ge=20&format=text&orderby=target&orderby=start\'";
$m2string = "curl -gs \'http://service.iris.edu/mustang/measurements/1/query?metric=dead_channel_lin&network=IU&channel=BH[12ENZ]&timewindow=2015-06-01,2015-06-04&value_le=2&format=text&orderby=target&orderby=start\'";

@arrMetric1 = @arrMetric2 = ();

## Retrieve query 1 results
##
open METRIC1, "$m1string |"
        or die "can't fork $!";
print"$m1string\n";
while (<METRIC1>) {
    s/"//g;
    if (/:/) {
        ($value1, $target1, $start1, @rest) = split(/,/);
        $current1 = $target1 . " " . $start1;
        $hash1{$current1} = $current1;
    }
}
close(METRIC1);

## Retrieve query 2 results
##
open METRIC2, "$m2string |"
        or die "can't fork $!";
print"$m2string\n";
while (<METRIC2>) {
    s/"//g;
    if (/:/) {
        ($value2, $target2, $start2, @rest) = split(/,/);
        $current2 = $target2 . " " . $start2;
        $hash2{$current2} = $current2;
    }
}
close(METRIC2);

##Compare results
@common = grep { exists $hash2{$_} } keys %hash1;
@common = sort(@common);

##Print SNCL/days common to both queries
print "\nSNCL/days returned by both queries:\n";
for ($i=0; $i<=$#common; $i++) { print "$common[$i]\n"; }
identified 20 IU channels that were dead for one or more days from 2015/06/01 through 2016/06/03.
Do Metrics Arithmetic
Most stations can have a “bad day” once in a while when it comes to gaps and you would like to know about any channel days whose gaps exceed some threshold. But suppose you also have some engineers’ time available to fix stations with continuing problems. It’s the stations that have gaps daily – even just one or two – that can most likely be fixed.
You can retrieve measurements where num_gaps>=your_threshold to tell you which channels/days were “bad”. But to find stations with smaller numbers of gaps regularly, you may want to calculate the average number of gaps/day over your window of interest:
- averageGaps = sum(num_gaps) / count(num_gaps)
Recognizing that a station with 5 gaps that was up for 24 hours is different than a station with 5 gaps that was only up for 2 hours, It would be ideal to take uptime into account. To scale by percent_availability:
- averageGaps = [sum(num_gaps values) * (100 / percent_availability)] / count(num_gaps measurements)
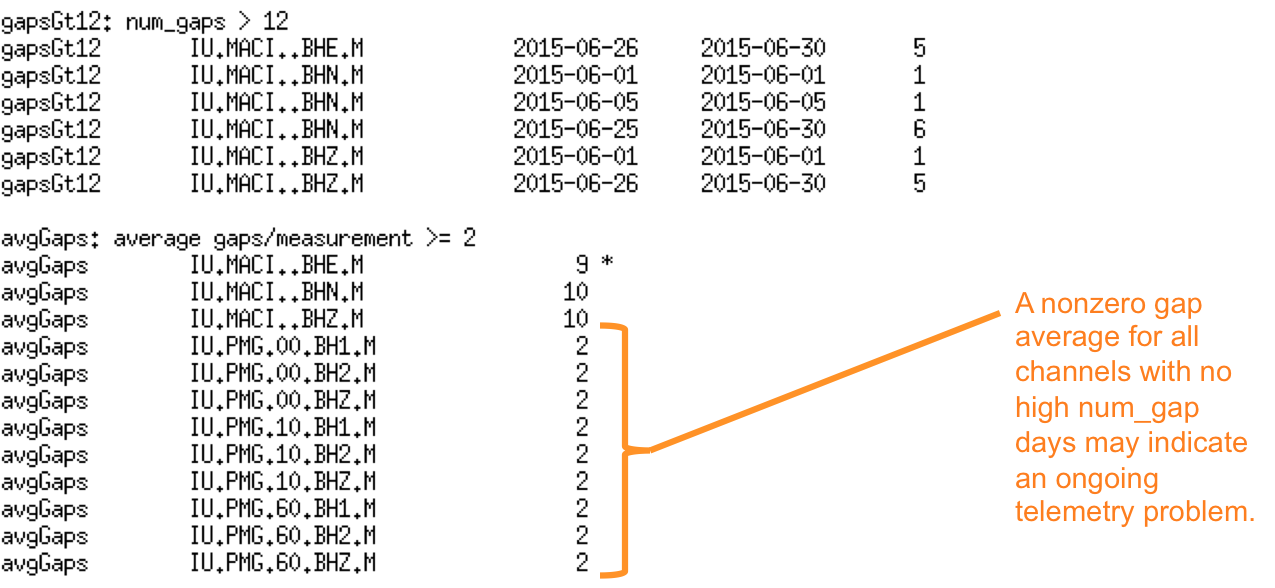
Now you can use both the average number of gaps and the number of days the gap count exceed some threshold to tell you which stations had a small number of gaps consistently vs. many gaps occasionally. The example below from a Data Services internal report illustrates how computing the average number of gaps identified an ongoing telemetry problem at station IU.PMG.
Some Metrics Tests for Broadband Data
Below is a list of the metrics that can be used for finding possible issues in broadband data:
- noData: percent_availability = 0
- gapRatioGt012: num_gaps/percent_availability > 12
- avgGaps: average gaps/measurement >= 2
- noTime: clock_locked = 0
- poorTQual: 0 <= timing_quality < 60
- suspectTime: suspect_time_tag > 1
- ampSat: amplifier_saturation > 0
- filtChg: digital_filter_charging > 2
- clip: digitizer_clipping > 0
- spikes: spikes > 0
- glitch: glitches > 0
- padding: missing_padded_data > 0
- tsync: telemetry_sync_error > 0
- dead: dead_channel_gsn = 1
- pegged: abs(sample_mean) > 10e+7
- lowAmp: dead_channel_lin <= 2 && pct_below_nlnm > 20
- noise: dead_channel_lin >= 2 && pct_above_nhnm > 20
- hiAmp: sample_rms > 50000
- dcOffsets: dc_offset > 50
- avgSpikes: average spikes/measurement >= 100
- badRESP: pct_above_nhnm > 90 || pct_below_nlnm > 90
- nSpikes: num_spikes > 500
Once any measurements have been retrieved that could indicate a possible data problem, the next step is to review them to determine which represent true problems.
Reviewing Potential Data Problems
The following web-based tools can help you explore data with possible quality issues to determine whether your retrieved metrics measurements had flagged a real problem.
MUSTANG Databrowser
This visualization tool, located at http://ds.iris.edu/mustang/databrowser/, is very useful for:
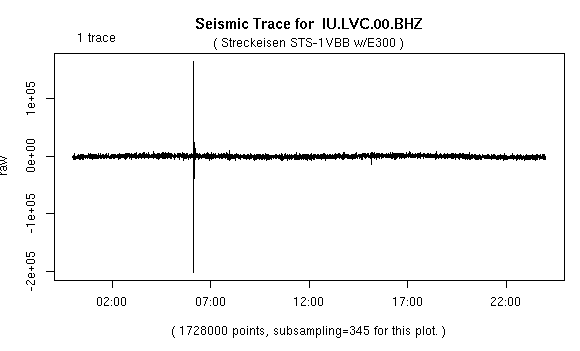
- plotting measurements for one or more metrics over time:
- plotting one or more days of trace data:
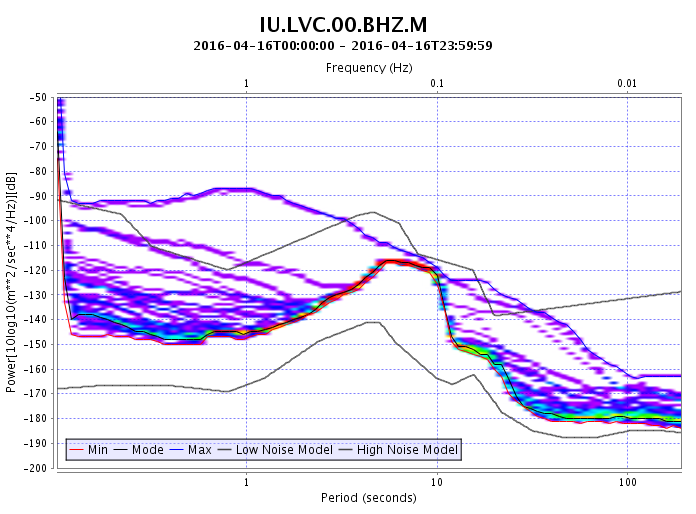
- displaying single-channel PDF plots:
- toggling between trace and PDF plots.
Displaying metrics values over time can show when a problem began and ended. Reviewing the trace and PDF data can help reveal whether there is a hardware problem, an event, or whether the station was undergoing maintenance. Because the Databrowser only plots traces in windows of integer days, the displays are fairly low resolution.
Web Services for Time Series Display
When plotting less than a full day of trace data, the timeseriesplot web service found at http://service.iris.edu/irisws/timeseriesplot/1/ allows much better resolution than the Databrowser:
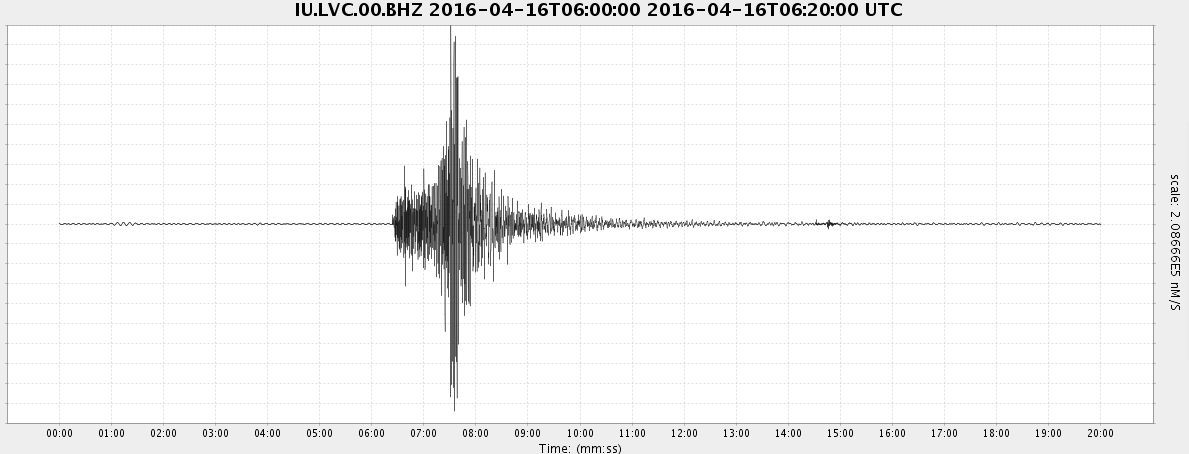
If you wish to process the time series before displaying it (scaling, instrument correction, filtering and more), you can do it with the timeseries web service found (http://service.iris.edu/irisws/timeseries/1/).
PDF-based Tools
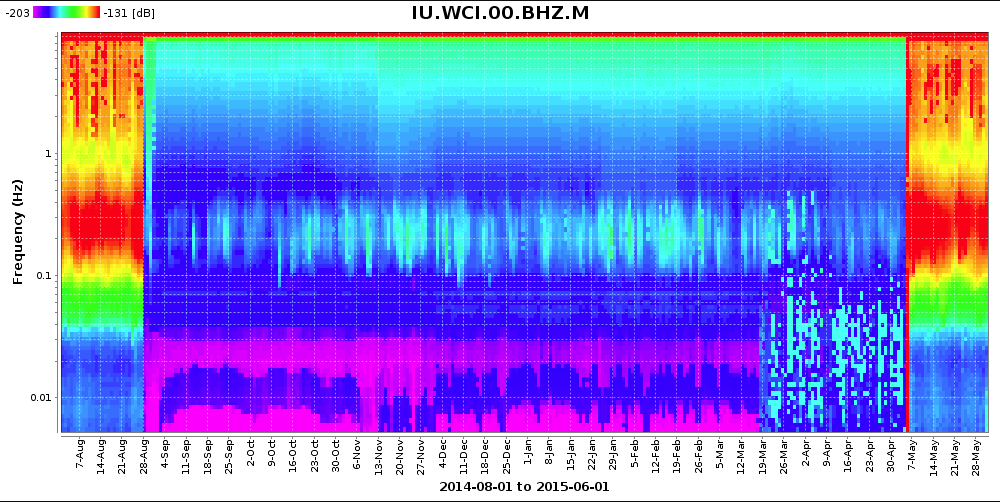
As mentioned earlier, plotting metrics measurements with time can show when a related problem began and ended. For problems that are visible on PDF plots, the noise-mode-timeseries service that plots daily PDF mode values at specific frequencies for a channel over time, also reveals when a problem began and ended, such as the illustrated low amplitude problem at IU.WCI.00.BHZ in 2015:
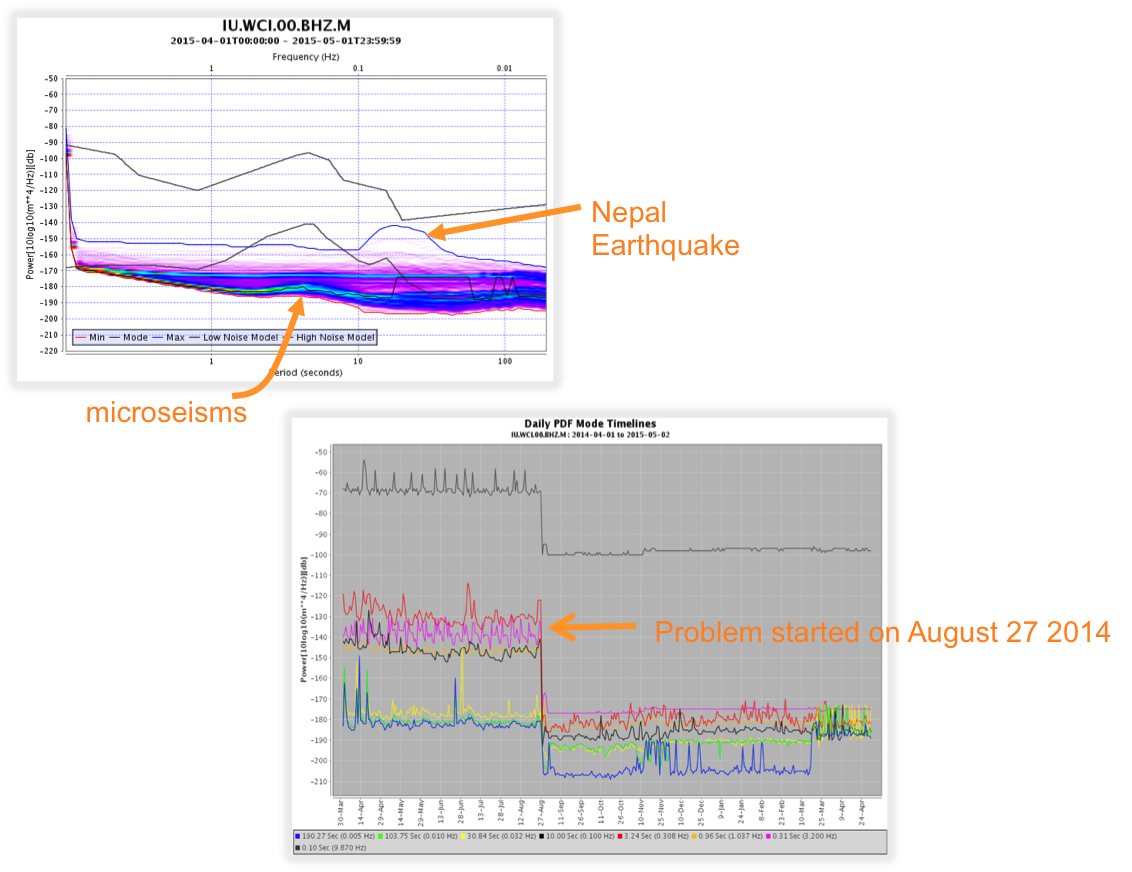
Two additional web services, noise-spectrogram and noise-pdf-browser provide alternative ways to drill down in time to the beginning of a data problem. Like the noise-mode-timeseries, the spectrogram displays a daily timeline of the PDF mode power, but at all frequencies with power levels displayed as color:
The noise-pdf browser allows you to click on a PDF to display it over smaller time windows from a year to a single day:
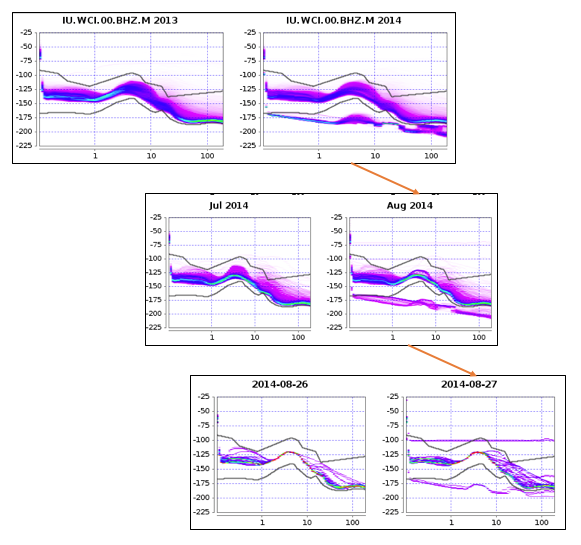
The noise-pdf, noise-mode-timeseries, noise-spectrogram and noise-pdf-browser services can be found here:
- http://service.iris.edu/mustang/noise-pdf/1/
- http://service.iris.edu/mustang/noise-mode-timeseries/1/
- http://service.iris.edu/mustang/noise-spectrogram/1/
- http://service.iris.edu/mustang/noise-pdf-browser/1/
Some Metadata Sanity Checks — It is also easy to incorporate a few basic metadata sanity checks into a QA routine. The station web service returns the following metadata values:
- network
- station
- location
- channel
- latitude
- longitude
- elevation
- depth
- azimuth
- dip
- sensor description
- scale
- scale Frequency
- scale Units
- sample Rate
This web service is found at http://service.iris.edu/fdsnws/station/1/ and the output of a sample query can be seen here:
Parsing this output allows these types of sanity checks:
- zDip: Z Dip > -90
- horDip: Horizontal Dip != 0
- zeroZ: Elev = Depth = 0
- lowScale: Scale <= 0
- nonMSUnits: Input units != M/S
with more checks possible. Although not all cases returned by these metrics tests are real problems, these checks tend to flag problems that are often overlooked.
References
Peterson, J, 1993, Observations and Modeling of Seismic Background Noise, U.S.G.S. OFR-93-322


