Summary
SENAM_FWT2021 is a 3-D, high-resolution shear-wave lithospheric velocity model beneath the southern part of eastern North American margin, which is constructed with full-wave ambient noise tomography by integrating onshore and offshore seismic datasets.
Quicklinks
Description
| Name | SENAM_FWT2021 |
| Title | 3-D shear-wave velocity model of the eastern North American lithosphere |
| Type | 3-D Full-wave ambient noise tomography Earth model |
| Sub Type | Shear-wave velocity model |
| Year | 2021 |
| Data Revision | r0.0 (revision history) |
| Short Description | A high-resolution shear-wave lithospheric velocity model beneath the southern part of eastern North American margin, which is constructed with full-wave ambient noise tomography |
| Authors: | Cong Li, Department of Geosciences, University of Massachusetts Amherst, 627 North Pleasant Street. Amherst, MA 01003, E-mail: conli@geo.umass.edu Haiying Gao, Department of Geosciences, University of Massachusetts Amherst, 627 North Pleasant Street. Amherst, MA 01003, E-mail: haiyinggao@geo.umass.edu |
| Previous Model | N/A |
| Reference Model | CUB shear velocity model provided by Shapiro & Ritzwoller, 2002 |
| Model Download | SouthernENAM-FWT-2021-0.20deg.r0.0.nc (see metadata) in the Polar Stereographic Projection and in netCDF 3 Classic format. |
| Original Model Repository | https://osf.io/ws2pn/ |
| Depth Coverage | 0-100 km |
| Area | The southern part of eastern North America margin (latitude: 30.56°/39.5°; longitude: 277.5°/289.46°) |
| Data Set Description | SENAM_FWT_2021_0.020.nc includes latitude, longitude, depth, and absolute S-wave velocity in eastern North America. The model was parameterized into a regular 0.020-degree horizontal grids in longitude and latitude directions. The vertical grid size increases with depth from one-third of the horizontal grid size for the top 15 km to ~2 km at 100 km depth. |

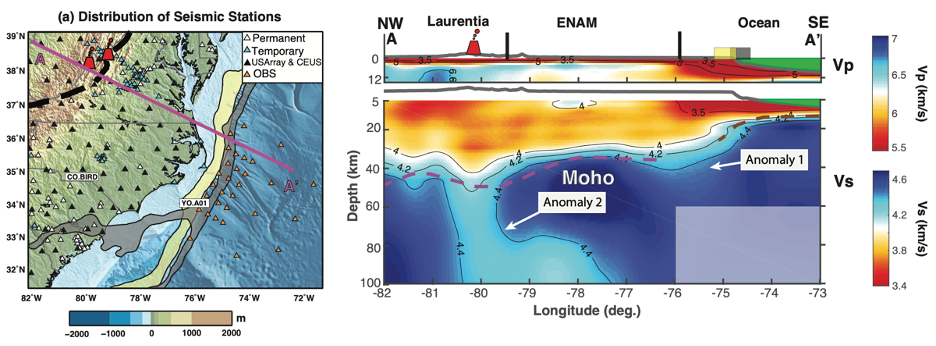
(b) Cross-sections of the seismic tomographic model. P-wave velocities for the top 12 km depths (upper panel) and S-wave velocities at the depths of 5-100 km for the continental part and at the depths of 5-60 km for the oceanic part (lower panel). The pink dashed line denotes the continental Moho inferred from teleseismic receiver functions by Li et al. (2020), and the brown dashed line denotes the oceanic Moho inferred from the 2-D active-source survey by Holbrook et al. (1994). The yellow and gray columns represent the gravity and magnetic anomalies, respectively. The thick gray line on the top of each profile corresponds to the topography/bathemetry. The green patches represent the water layer, which has a velocity of 1.5 km/s.
Citations and DOIs
To cite the original work behind this Earth model:
- Li, C. & Gao, H. (2021). Modification of crust and mantle lithosphere beneath the southern part of the eastern North American passive margin. Geophysical Research Letters (accepted).
To cite IRIS DMC Data Products effort:
- Trabant, C., A. R. Hutko, M. Bahavar, R. Karstens, T. Ahern, and R. Aster (2012), Data Products at the IRIS DMC: Stepping Stones for Research and Other Applications, Seismological Research Letters, 83(5), 846–854, https://doi.org/10.1785/0220120032.
DOI for this EMC webpage: https://doi.org/10.17611/dp/emc.2021.senamfwt.1
References
- Li, C., Gao, H., & Williams, M. L. (2020). Seismic characteristics of the eastern North American crust with Ps converted waves: Terrane accretion and modification of continental crust. Journal of Geophysical Research: Solid Earth, 125, 5. https://doi.org/10.1029/2019JB018727
- Shapiro, N. M., & Ritzwoller, M. H. (2002). Monte-Carlo inversion for a global shear velocity model of the crust and upper mantle. Geophysical Journal International, 151, 88-105. https://doi.org/10.1046/j.1365-246X.2002.01742.x
- Holbrook, W. S., Purdy, G. M., Sheridan, R. E., Glover, L., Talwani, M., Ewing, J., et al. (1994). Seismic structure of the U.S. mid-Atlantic continental margin. Journal of Geophysical Research Atmospheres, 991(B9), 17871-17891. https://doi.org/10.1029/94JB00729
Credits
- r0.0 model provided by Cong Li.
Revision History
revision r0.0: uploaded July 28, 2021.
Timeline
- 2021-07-28
- online


