Summary
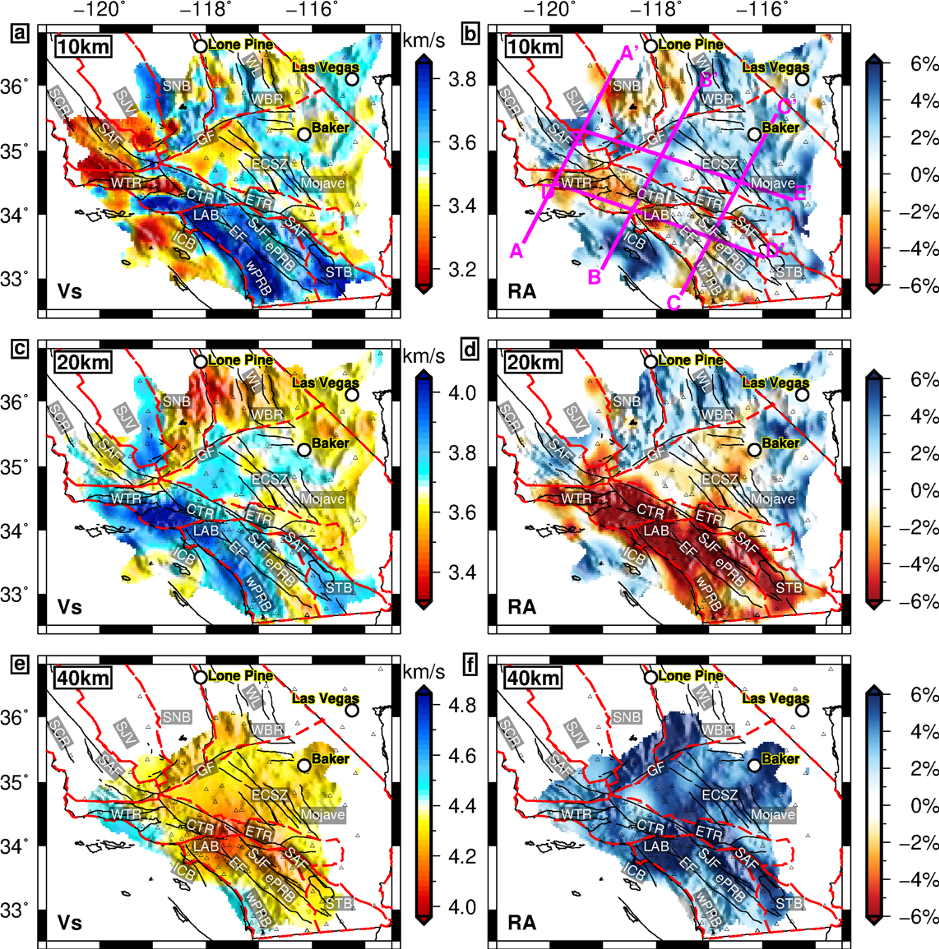
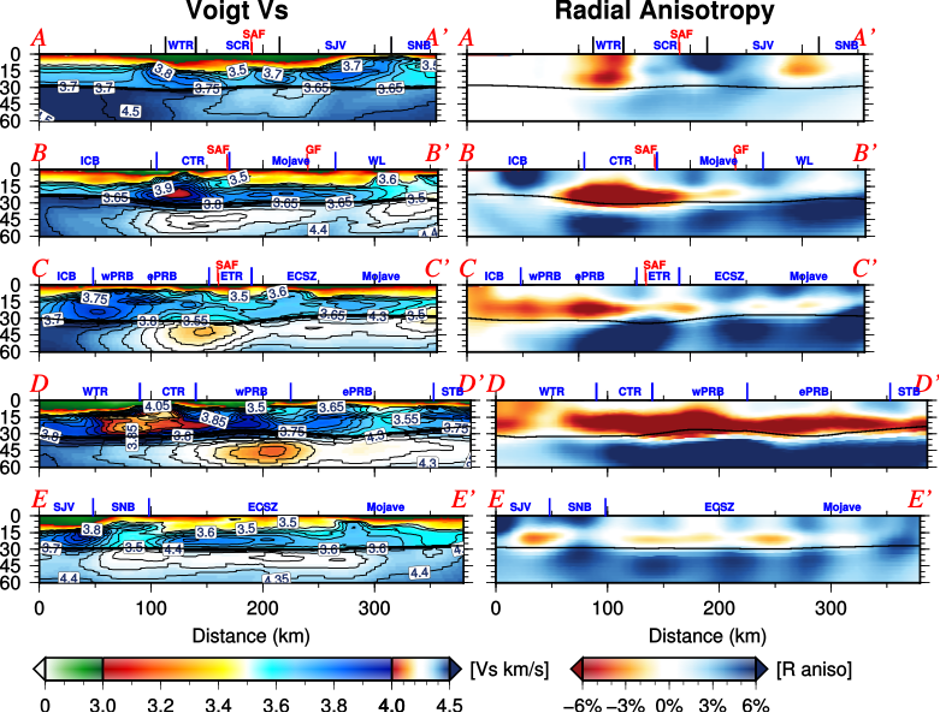
SoCal.ANAT_Vs+RA.Wang.2020 is a radially shear wave velocity model from adjoint tomography of Rayleigh and Love waves at 5-50 s extracted from three-component ambient noise cross correlation functions of Southern California.
Quicklinks
Description
| Name | SoCal.ANAT_Vs+RA.Wang.2020 | ||
| Title | A radially anisotropic shear-wave model of Southern California from ambient noise adjoint tomography | ||
| Type | 3-D Tomography Earth Model | ||
| Sub Type | Shear-wave velocity (km/s) | ||
| Year | 2020 | ||
| Short Description | This is a radially shear wave velocity model from adjoint tomography of Rayleigh and Love waves at 5-50s extracted from three-component ambient noise cross correlation functions of Southern California. |
||
| Authors: | |||
| Kai Wang Department of Earth and Planetary Sciences Macquarie University Balaclava Rd, Macquarie Park, NSW, 2109, Australia |
|||
| Yingjie Yang Department of Earth and Planetary Sciences Macquarie University Balaclava Rd, Macquarie Park, NSW, 2109, Australia |
|||
| Qinya Liu Department of Physics & Department of Earth Sciences, University of Toronto 27 King’s College Cir, Toronto, ON M5S, Canada |
|||
| Chengxin Jiang Department of Earth and Planetary Sciences, Harvard University Cambridge, MA, USA. |
|||
| Vera Schulte-Pelkum Cooperative Institute for Research in Environmental Sciences and Department of Geological Sciences, University of Colorado Boulder Boulder, CO 80309, USA |
|||
| Piero Basini Total, 64000 Pau, France. |
|||
| Carl Tape Geophysical Institute and Department of Geosciences University of Alaska Fairbanks Fairbanks, AK 99775-7320, USA |
|||
| Ping Tong Division of Mathematical Sciences, School of Physical and Mathematical Sciences and Asian School of the Environment Nanyang Technological University Singapore, 639798, Singapore |
|||
| Previous Model | None | ||
| Reference Model | None | ||
| Model Homepage | https://sites.google.com/view/kaikaiwang/products |
||
| Model Download | SoCal SPECFEM3D mesh files (Socal_specfem3d_meshfiles) Model binaries files (model_M28_bin) SoCal.ANAT-Vs+RA.Wang.2020.nc (see metadata), is the netCDF file for the model |
||
| Depth Coverage | -2.5 to 60.0 km (below earth surface) | ||
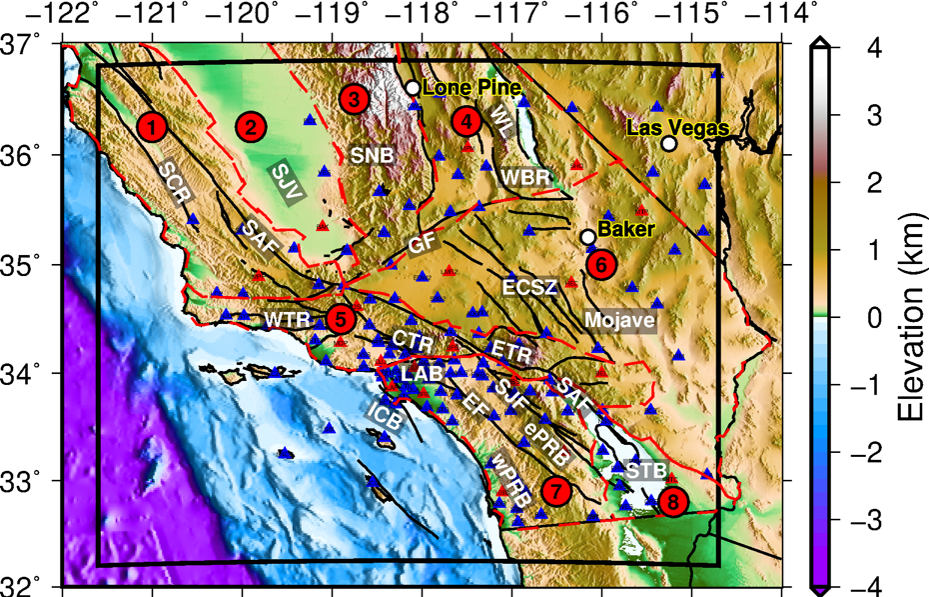
| Area | Southern California (latitude 32.2°N/36.8°N, longitude 121.6°W/114.7°W) | ||
| Data Set Description | [Wang et al. (2020)] Dataset includes S-wave velocity structure across Southern California based on 10504 Rayleigh waves and 10463 Love waves filtered at 5-50s from three-component ambient noise recorded by 148 regional stations from 2006 to 2012. | ||


Citations and DOIs
To cite the original work behind this Earth model:
- Wang K., Y. Yang, P. Basini, P. Tong, C. Tape, and Q. Liu, 2018. Refined crustal and uppermost structure of southern California by ambient noise adjoint tomography. Geophysical Journal International, 215(3), 844-863. https://doi.org/10.1093/gji/ggy312
- Wang K., Q. Liu, and Y. Yang, 2019. Three-Dimensional Sensitivity Kernels for Multi-component Empirical Green’s Functions From Ambient Noise: Methodology and Application to Adjoint Tomography. Journal of Geophysical Research: Solid Earth, 124(6), 5794-5810. https://doi.org/10.1029/2018JB017020
- Wang, K., Jiang, C., Yang, Y., Schulte‐Pelkum, V., & Liu, Q. ( 2020). Crustal deformation in Southern California constrained by radial anisotropy from ambient noise adjoint tomography. Geophysical Research Letters, 47, e2020GL088580. https://doi.org/10.1029/2020GL088580
To cite IRIS DMC Data Products effort:
- Trabant, C., A. R. Hutko, M. Bahavar, R. Karstens, T. Ahern, and R. Aster (2012), Data Products at the IRIS DMC: Stepping Stones for Research and Other Applications, Seismological Research Letters, 83(5), 846–854, https://doi.org/10.1785/0220120032.
DOI for this EMC webpage:
References
- Tape, C., Liu, Q., Maggi, A., & Tromp, J. (2009). Adjoint tomography of the southern California crust. Science, 325(5943), 988–992. https://doi.org/10.1126/science.1175298
- Tape, C., Liu, Q., Maggi, A., & Tromp, J. (2010). Seismic tomography of the southern California crust based on spectral-element and adjoint methods. Geophysical Journal International, 180(1), 433–462. https://doi.org/10.1111/j.1365-246X.2009.04429.x
- Barak, S., Klemperer, S. L., and Lawrence, J. F. ( 2015), San Andreas Fault dip, Peninsular Ranges mafic lower crust and partial melt in the Salton Trough, Southern California, from ambient‐noise tomography, Geochem. Geophys. Geosyst., 16, 3946– 3972. https://doi.org/10.1002/2015GC005970
- Lee, E. J., Chen, P., Jordan, T. H., Maechling, P. B., Denolle, M. A., & Beroza, G. C. (2014). Full-3-D tomography for crustal structure in southern California based on the scattering-integral and the adjoint-waveform methods. Journal of Geophysical Research: Solid Earth, 119, 6421–6451. https://doi.org/10.1002/2014JB011346
Credits
Model provided by Kai Wang
Timeline
- 2020-04-21
- online


