


Overview
Quality assurance measurements and assessment are performed on USArray data arriving at the DMC in collaboration with other quality monitoring efforts being done upstream from the DMC. For data delivered to the DMC in real-time streams QA is applied as it arrives at the DMC. The DMC’s QA effort involves a number of automated measurements along with analyst review of both raw data and the results of the automated measurements.
Quick links
QA Resources
- Station Info – A collection area for USArray station details, including station history, field reports, PDF-based measurements, etc.
- Transportable Array – Direct link to the Station Info TA network stations
- Signal to Synthetic comparisons
- DMC QA Reports for TA – Routinely generated weekly reports for the TA network
- MUSTANG – All automated quality assurance measurement results from the MUSTANG system are available through web services, including signal RMS (standard deviation), signal mean, data coverage, gaps and overlaps along with other measurements.
- Data Problem Reports – DPRs are issued for significant issues with the primary seismic channels. This interface allows searching for all DPRs stored at the DMC, and is not limited to those for USArray stations.
- TA Quality Assessment Results (2005-2008) – These are individual studies of various metrics useful to quantify the overall quality of the Transportable Array:
- Gap analysis – A study of gaps in the TA network data
- Detection analysis – A study of STA/LTA detections for the TA, AK, II, IU and US networks
- Sensor comparison – Noise comparison between the TA network sensors
- Updated sensor comparison plots for 2008-2012: BH[EN], BHZ
- Network comparison – Noise comparison between TA, US, and selected GSN sensors
- US-TA and PBO Quarterly Quality Metrics – Gap and Continuity Histograms (3rd Quarter 2009 – 2014)
- Gap analysis – number of gaps per station-day in histogram plots
- Continuity analysis – longest contiguous data segment per month per station in histogram plots
Analyst Review
The review process includes quality assessment of both metadata and waveform data. The primary objective of the assessment is to identify sensor or digitizer malfunction, bad vault conditions, environmental noise sources, and incorrect metadata.
Analysts at the DMC routinely review all 1 sample/second seismic data streams from the Transportable Array and a significant portion of the higher rate data (usally 40 Hz, sometimes 100 Hz). The analyst review is focussed on two objectives: 1) relatively quick identification and reporting of station issues and 2) documentation of data issues for future data use and evaluation. For waveform review DMC analysts use the PQLX system.
Routine Review
The DMC performs observational review of waveform data every 1 to 2 days with a focus on the 1 sps channels. The review processing includes the following observations:
- Raw data in 1+ day windows
- Low-pass (30-300 seconds) filtered data in 2+ day windows to identify sensor related problems
- Inspection of smaller or larger time windows as needed using various filters and transforms
- Inspection of spectra and PDFs to identify noise sources and channel characteristics
- PDF-based measurements are reviewed for changes and indications of data problems
- MUSTANG metrics and reports are reviewed for indications of data problems
The routine review results in:
- Issue specific reports are emailed to nework operators
- Weekly reports – Transportable Array
- Data Problem Reports – DPRs are filed for significant issues with the primary seismic channels, meaning issues that will prohibit or adversely effect common reseach analyses. The DMC’s Data Problem Report database contains DPRs from numerous networks and stations and is not specifically for USArray stations. File a new DPR »
Automated QA Processes
- MUSTANG – All USArray data arriving at the DMC is processed using the DMC’s MUSTANG system which performs a variety of quality related measurements.
- PDF based measurements – The following image products are routinely calculated from the PDF spectral analysis data and are available in the station specific sections of Station Info:
http://crunch.iris.washington.edu/stationinfo/$network/$station/PDFs
where $network is the network code and $station is the station code.
- Classical PDFs: illustrating station background noise as a probability density function
- Daily PDF Mode Color Grids: tracking background noise (relative to a noise model)
- Daily PDF Mode Timelines: tracking background noise for specific frequencies
Examples
| PDF Mode Timeline | PDF Mode Color Grid | Classic PDF |
|---|---|---|
 |
 |
 |
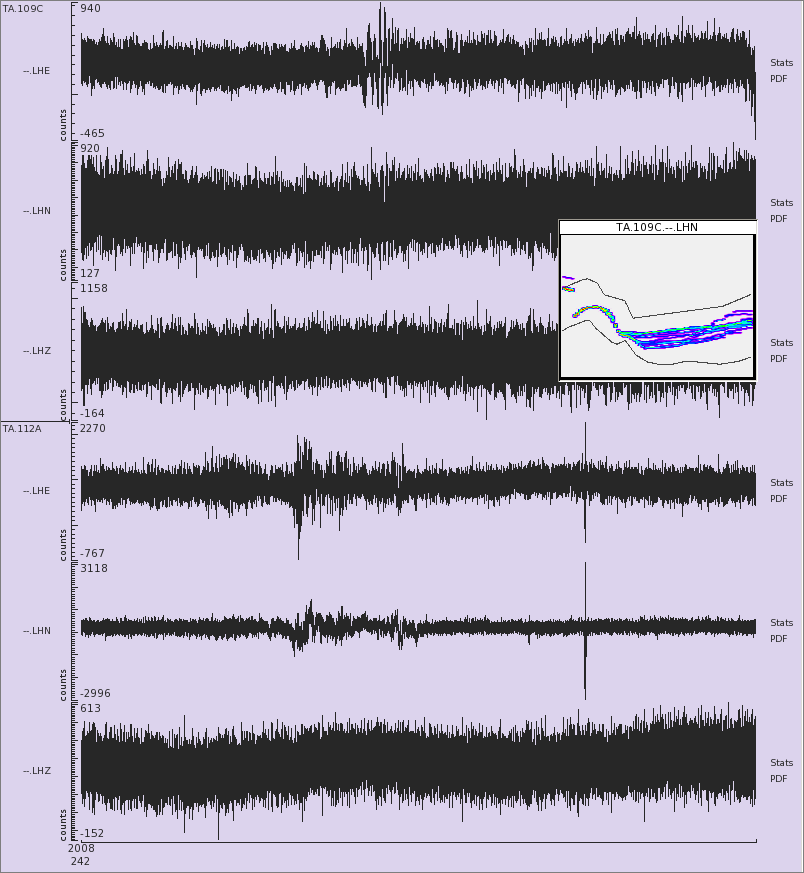
A convenient way to access these images is through the station PDF link on the USArray,_CASCADIA-TA, and _CEUSN Station List or the _US-TA Station List. The Browser page includes small versions of each image for each BHE, BHN, and BHZ channel of the station for the last 60 days of station operation. Clicking on the small versions will return PDF plots for the entire station history, colorgrid plots for 2 years of history, and timelines for 5 years of history. As an example see the PDF Browser for TA station 109C.


![BH[EN]](/files/earthscope/usarray/qc/images/TA_Sensor_BHEN_2008.2012_mean_modes.png)