|
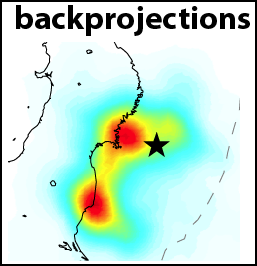
The Back Projection (BP) product shows the beamformed time history and location of
coherent short period P-wave energy generated by large earthquakes observed at
three regional arrays and across the Global Seismic Network. These are automatically
generated following all global M6.5+ earthquakes.
Virtual networks are formed by choosing stations within 25 degrees distance or azimuth
to the center of three continents (NAmerica, EUrope, AUstralia). All available BHZ data
are then aligned using a Multi-Channel Cross Correlation scheme which also downsamples
the network by only choosing the stations with the highest average cross-correlation
coefficient and at least one degree distance to it's nearest neighboring stations. BPs
are performed by beam forming energy using square-root stacking to a flat grid around
the source region with variable spatial resolution scaled by the magnitude of the
earthquake. A 5 s wide cosine taper is used to average the beams. BP results are then
averaged over time windows whose length increases with magnitude.
The upper gallery shows a movie of the combined BPs from all networks with sufficient
data. The array response function is also shown which is generated using the same
processing techniques and stations, except the raw data are replaced with synthetic
seismograms with 5 s wide point-source triangle functions. The first and last frames
show cumulative time integrated results. Results are affected by radiation pattern,
Greens functions variations and array geometry. Warmer colors indicate greater beam
power. A small cross shows the location of the peak beam power when absolute beam
powers are low.
The lower gallery shows a summary figure for each array's BP as well as the individual
array movie. In the summary figure, the lower left panel shows the time and location of
local maxima. The colors correspond to relative time and the diameter to relative beam
power. The other panels show the time-integrated results, the source-receiver geometry,
and the MCCC aligned traces.
At the bottom of the page, text files with peak beam power (and their Lat/Lon location)
as a function of time relative to origin are given for both the data and the synthetic
ARF.
For more information on Back Projections visit the
Backprojection product page.
|


