About SPUD

SPUD Version 3.0

The Searchable Product Depository (SPUD) is the IRIS DMC's primary data product management system. Complementing the DMC's SEED and assembled data archives, which contain time series recordings, the SPUD system primarily contains derivative data products of other types (images, movies, etc.) created either at the DMC or by members of the community.

For users SPUD is the query and access point for these products. The web interfaces allow users to search for products using customized queries across product and event details. Users can search across all product types at once or within specific product types. SPUD also has web service interfaces for programmatic discovery and access to the data products.

If any products from SPUD are used in your research please be sure to cite the identified author of the product and the IRIS DMS [Citation Information].

About Earth Model Products

The Earth models presented here are contributed to the IRIS Earth Model Collaboration (EMC) by various researchers.

Two general types of model are available for download:

  • Tomography Models:
    The contributed Earth models in their original format and in a common netCDF (network Common Data Form). A model overview page provides a summary of the model.

  • Reference Models:
    Most EMC Earth models are expressed as perturbations relative to a particular reference 1-D model. These reference models are available for download in expanded comma separated value (CSV) file format with the first two lines representing the file’s header.

For model visualization and additional information about the models visit the IRIS EMC Product Page.

Citing Earth Model Products

If you use Earth Models in publications, please cite according to the instructions at:

Ulberg, C. W., Creager, K. C., Moran, S. C., Abers, G. A., Thelen, W. A., Levander, A., et al. ( 2020). Local source Vp and Vs tomography in the Mount St. Helens region with the iMUSH broadband array. Geochemistry, Geophysics, Geosystems, 21, e2019GC008888. https://doi.org/10.1029/2019GC008888

http://ds.iris.edu/ds/products/emc/#citation

When citing this Earth Model page please use the Digital Object Identifier (DOI):

doi:10.17611/DP/18142223

Earth Model Help

The page displays information for individual Earth Models.

The model information is summarized at the top including links to further information.

3-D velocity models of the Mount St. Helens region using local-source travel-time tomography icon
Model Summary
Name:  iMUSH_localEQ_Ulberg_2020
Title:  3-D velocity models of the Mount St. Helens region using local-source travel-time tomography
Type: 3-D Tomography Earth Model
Sub Type:  Compressional and shear-wave velocity (km/s)
Year 2020
Author(s): Carl Ulberg (Earth and Space Sciences, University of Washington, Seattle, WA, USA)
Kenneth Creager (Earth and Space Sciences, University of Washington, Seattle, WA, USA)
Seth Moran (United States Geological Survey Cascades Volcano Observatory, Vancouver, WA, USA)
Geoffrey Abers (Earth and Atmospheric Sciences, Cornell University, Ithaca, NY, USA)
Weston Thelen (United States Geological Survey Cascades Volcano Observatory, Vancouver, WA, USA)
Alan Levander (Earth, Environmental, and Planetary Science, Rice University, Houston, TX, USA)
Eric Kiser (Geosciences, University of Arizona, Tucson, AZ, USA)
Brandon Schmandt (Earth and Planetary Science, University of New Mexico, Albuquerque, NM, USA)
Steven Hansen (Earth and Planetary Sciences, Macquarie University, Sydney, New South Wales, Australia)
Robert Crosson (Earth and Space Sciences, University of Washington, Seattle, WA, USA)
Reference(s): Ulberg, C. W., Creager, K. C., Moran, S. C., Abers, G. A., Thelen, W. A., Levander, A., et al. ( 2020). Local source Vp and Vs tomography in the Mount St. Helens region with the iMUSH broadband array. Geochemistry, Geophysics, Geosystems, 21, e2019GC008888. https://doi.org/10.1029/2019GC008888
DOI: doi:10.17611/DP/18142223
Depth Coverage: -5.0 - 55.0 km
Areal Coverage: Latitude: 45.18 to 47.34 Longitude: -123.71 to -120.69
Model Description 
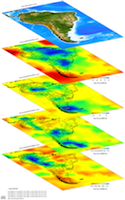
iMUSH_localEQ_Ulberg_2020 contains 3-D Vp and Vs velocity models of the upper crust near Mount St. Helens, WA, obtained using local-source travel-time tomography. Velocities were obtained using an iterative, nonlinear, conjugate gradient, least squares inversion code with a finite-difference 3-D eikonal equation solver.
Data Set Description [Ulberg et al., 2020] Five absolute velocity models were produced using arrival times from local earthquakes and active blasts: the ‘normal’ Vp (~29,000 arrival times), ‘normal’ Vs (~4700), ‘matched’ Vp and Vs (~3600; these were calculated in order to obtain a more robust Vp/Vs measurement), and ‘large’ Vp (~74,000) models. Velocity perturbation plots in Ulberg et al. (2020) were made using depth-averaged velocities from these models (Table S2).
EMC Page ds.iris.edu/ds/products/emc-imush_localeq_ulberg_2020/
Model Data
DescriptionSizeModel
The netCDF binary for the above model 40.9 MB
Depth slices through (a, d, g, and j) Vp, (b, e, h, and k) Vs, and (c, f, and i) Vp/Vs models at 1.0, 5.8. 9.4, and 14.2 km below sea level. Vp and Vs figures show percent variation from a 1‐D model (Figure S8), while Vp/Vs show the velocity ratio. White contours show absolute velocity or ratio value, regions with strong semblance for features with 20‐, 10‐, and 5‐km size are shown with black, dashed black, and dash‐dotted black contours, respectively. Earthquakes used in inversion (filled black circles) and PNSN catalog earthquakes (open black circles) are also shown, for events within 0.6 km of the depth shown. Red triangles indicate position of MSH, Mount Adams, and Mount Rainier; letter codes are the same as in Table 1. For the Vp and Vs figures, the reference velocity at each depth is shown in the lower left corner.
Model Areal Coverage
Contributions