The following products are in the
i
— Internal
category (13):
EMC
EarthScope Earth Model Collaboration
A repository of Earth models with the aim of providing the research community with access to various Earth models, visualization tools for model preview, facilities to extract model data/metadata and access to the contributed processing software and scripts.
More information »
GMV
The Ground Motion Visualization
Visualizations of real data showing how seismic waves from earthquakes sweep across the North American network of seismic stations for which data are openly available and are collected using the federated data access.
More information »
EventPlots
Maps, record sections & other plots for M6.0+ events
The IRIS DMC's Event Plot product is a suite of plots that are automatically generated following all earthquakes of magnitude 6 or greater. The plot suite uses all open broadband data, or a sub-selection, available at the IRIS DMC at the time the product was generated. Based on data availability and signal quality, some plots may not be produced for certain events.
More information »
The Back-Projection (BP) product shows the beamformed time history and location of coherent short period P-wave energy generated by large earthquakes observed at three regional arrays and across the Global Seismic Network. These are generated following all global M6.5+ earthquakes. The back-projections typically take less than 10 minutes to compute, however arrival of event triggers, travel time of P-waves, downloading of data and shared DMC computing resources delays publication of results in SPUD to about an hour after origin time. These are fully automated and not reviewed by a human.
More information »
Global stacks of up to a million event-windowed seismograms using short-term to long-term averages (STA/LTA) in different frequency bands for vertical broadband data (1990-2012) available from the IRIS DMC. Long period versions include vertical and horizontal component data.
More information »
To support USArray TA infrasound data set, the IRIS Data Management Center (DMC) has developed two infrasound data products: the TA Infrasound Reference Event Database (TAIRED) and TA Infrasound Detections (TAID). These two data products are designed to provide insight and tools for researchers to begin working with this large, and somewhat unique, new data set.
More information »
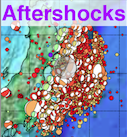
Animations and figures of seismicity automatically generated following large global earthquakes (Mag > 7).
More information »
Point-source synthetic seismograms are used along with vertical component recordings of short-arc Rayleigh waves (R1) from GCMT Mw7.0+ earthquakes to calculate source-time functions (STF) at GSN and other stations.
More information »
HVSR
Horizontal‐to‐Vertical Spectral Ratio (HVSR) IRIS Station Toolbox
The HVSR station software toolbox is a small suite of programs, written in Python, that allow users to perform HVSR analyses for seismic stations available from the IRIS DMC with minimum computational requirements. The toolbox utilizes the precomputed spectral analysis results from DMC’s MUSTANG quality assurance system to derive spectral powers and perform HVSR analyses.
More information »
The IRIS DMC Noise Toolkit is a collection of 3 open-source Python script bundles for:
- Computing Power Spectral Densities (PSD) of waveform data
- Performing microseism energy computations from PSDs
- Performing frequency dependent polarization analysis of seismograms
More information »
The DMC receives and archives phase arrivals from the Array Network Facility (ANF). These event bulletins are accessible via DMC’s Searchable Product Depository (SPUD).
More information »
Station Digest reports for decomissioned USArray Transportable Array stations.
More information »